Tech tip follow-up: Using the data Invoked with R's system command
In follow up to yesterday's discussion re invoking OS commands with R's system function, I wanted to show you just a bit of how straightforward it is to then use the resulting data.
After grabbing the Windows security event log with a call to Log Parser and writing it out to CSV, you have numerous options driven by what's interesting to you. Perhaps you're interested in counts per Event ID to say what your Top 10 events are. The issue is, that Log Parser just grabbed all of the security event log, which results in large, unwieldy CSV that includes large message data entries. No big deal, reduce the raw CSV to only data you need. As an example:
secevt <- read.columns("security.csv",c("EventID","TimeWritten","EventTypeName","Message"), sep=",")
This writes the EventID, TimeWritten, EventTypeName, Message columns into a new data frame, the contents of which are stored in secevt,the other 11 columns are no longer cluttering to the in-memory data set. Want to count Event IDs?
ct <- count(secevt$EventID)
Result snippet:
x freq
1 1108 734
2 4611 4
3 4616 1
4 4624 159
5 4634 49
6 4648 272
7 4656 2653
8 4658 1900
9 4662 27602
Want to sort that count decreasing by frequency?
srt <- ct[order(ct$freq, decreasing = TRUE), ]
Now to return the Top 10 specifically:
top10 <- head(srt,10)
Result snippet:
x freq
22 4703 81437
9 4662 27602
7 4656 2653
8 4658 1900
16 4690 931
1 1108 734
14 4688 618
15 4689 617
35 4957 400
11 4664 355
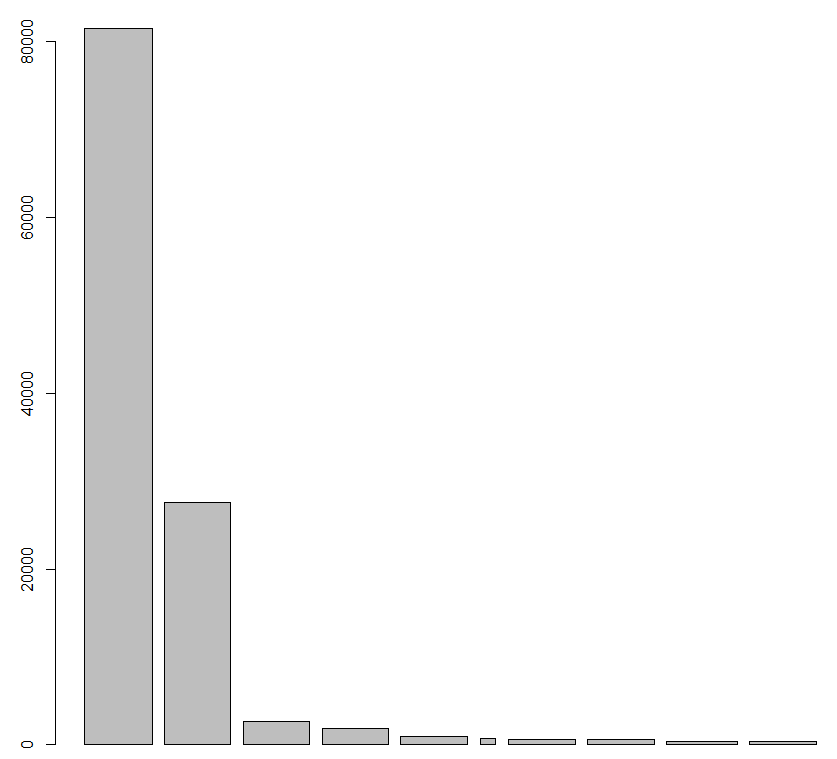
Bam, fast and flexible. My security event log has 81,437 Event ID 4703 (A user right was adjusted) entries, these parsed quickly from 118,154 total entries (147MB local file). How about visualizations of that same data? Yep, it all starts with something as simple as barplot(top10$freq,top10$x).
Hopefully you're intrigued regarding options and available capabilities here. Feel free to comment or email me if you'd like further information or resources with which to start exploring R.
Cheers.
froxlor Server Management Portal severe security issue
The froxlor Server Management Panel is lightweight server management software. Your Handler on Duty was unaware of foxlor, if diary readers are users, feel free to comment or email regarding your user experience and past security issues.
Per froxlor:
Due to a severe security issue in the database logging system, we strongly recommend to update your current froxlor installation to 0.9.33.2. We also recommend to remove any content from the /froxlor/logs/ directory.
Download: 0.9.33.2
Note: Gentoo-ebuild and Debian packages are now available..
Visit http://www.froxlor.org or join our IRC channel #froxlor on irc.freenode.net.
Tech tip: Invoke a system command in R
I spend a lot of time using R, the programming language and software environment for statistical computing and graphics. It's incredibly useful for visualization and analysis, consider Data-Driven Security as a great starting point and reference, along with this article, if you're further interested.
One of my recent discoveries (I'm new to R use, a terrible programmer and a worse statistician), is the use of system to invoke the OS command specified. As an example, I love Log Parser and often use it to parse or write out log events to CSV. Once in CSV they can be transformed and analyzed further in so many ways. One of the great things about R is the ability to ingest CSV and apply statical or visual methods to the data. With system, in two lines I can call Log Parser, pull the Windows security event log, write it to CSV, and create a data frame out of it that I can then do any number of other cool things with. Note: to pull the Windows security event log you need to be running with elevated privilege and need to run R as admin for this example scenario.
In short:
Set a working directory: setwd("D:/coding/R/EventVizWork")
Call Log Parser with system: system('logparser "Select * into security.csv from Security" -i:evt -o:csv')
Statistics:
-----------
Elements processed: 112155
Elements output: 112155
Execution time: 26.80 seconds
Read the results into a data frame: secevtlog <- read.csv("security.csv")
Tomorrow I'll show you what we can do with it. :-)


Comments