WannaCry? Do your own data analysis.
"In God we trust. All others must bring data." ~Bob Rudis
With endless amounts of data, technical detail, and insights on WannaCrypt/WannaCry, and even more FUD, speculation, and even downright trolling, herein is a proposal for you to do your own data-driven security analysis. My favorite book to help you scratch that itch? Data Driven Security: Analysis, Visualization and Dashboards, by Jay Jacobs & Bob Rudis. A few quick samples, using WannaCry data and R, the open source programming language and software environment for statistical computing and graphics. If ever you wanted to pick up a bit of immediately useful programming, R is for you.
Our good friends over at Team Cymru tweeted out a great GitHubGist WannaCry factsheet, therein are a number of useful resources, many leading to other good reads. I easily tracked down a list of malicious IPs associated with WannaCry.
You can always learn interesting insights from IPs and this situation is no different. In very few lines of R, we can identify and visualize the data for further insight. I'll walk you through it. First, let's pull in the libraries we need to do some IP geolocation, create a word cloud, and make said word cloud more color rich, and make a nice plot.
library(rgeolocate)
library(wordcloud)
library(RColorBrewer)
library(plotrix)
We need to then read in Maxmind data (GeoLite2-Country) and call Oliver Key and @hrbrmstr's rgeolocate package
file <- system.file("extdata","GeoLite2-Country.mmdb", package = "rgeolocate")
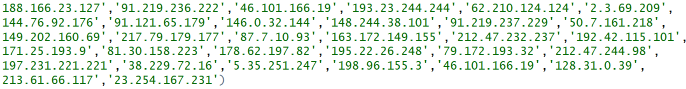
Follow that with our malicious WannaCry IP addresses.
ips <- c('188.166.23.127','91.219.236.222','46.101.166.19','193.23.244.244','62.210.124.124','2.3.69.209',
'144.76.92.176','91.121.65.179','146.0.32.144','148.244.38.101','91.219.237.229','50.7.161.218',
'149.202.160.69','217.79.179.177','87.7.10.93','163.172.149.155','212.47.232.237','192.42.115.101',
'171.25.193.9','81.30.158.223','178.62.197.82','195.22.26.248','79.172.193.32','212.47.244.98',
'197.231.221.221','38.229.72.16','5.35.251.247','198.96.155.3','46.101.166.19','128.31.0.39',
'213.61.66.117','23.254.167.231')
Finally, we pull it all together and receive our first results file.
results <- maxmind(ips, file, c("continent_name", "country_code", "country_name"))
results
.png)
And in one fell swoop, we create a word cloud from our data.
wordcloud(results$country_name, max.words = 100, min.freq = 1, random.order = FALSE, rot.per=0.35, colors=brewer.pal(8, "Dark2"))
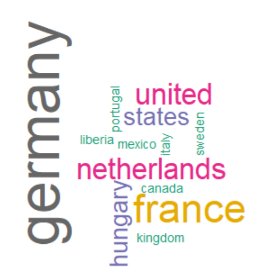
Hmm, looks like most of the malicious IPs are in Germany. :-)
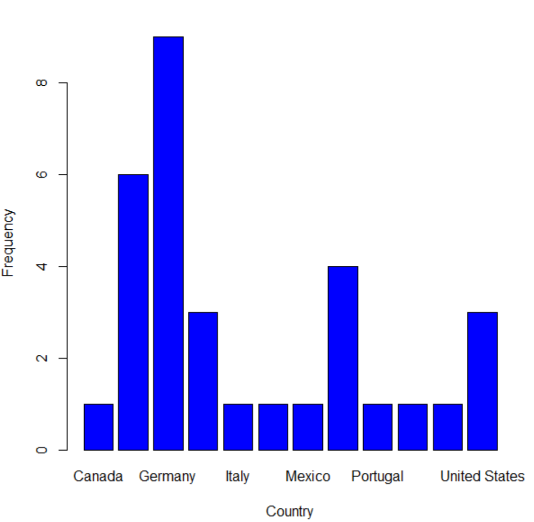
Prefer to visualize that a different way? No problem, we'll run a quick count and use plotH to create a scatterplot with histogram-like bars.
ct <- count(results$country_name)
plotH(freq~x,data=ct,ylab="Frequency",xlab="Country",col="blue")
Give it a try for yourself. When events such as WannaCry have you frustrated and down, you can at least take data-driven security analysis in your own hands.
Resources for this article:
- WannaCry – Thoughts and Threat Intelligence
- Introduction to rgeolocate
- Text mining and word cloud fundamentals in R : 5 simple steps you should know
Source code for this post: https://github.com/holisticinfosec/toolsmith_R
Cheers.


Comments