Anomaly Detection & Threat Hunting with Anomalize
When, in October and November's posts, I redefined DFIR under the premise of Deeper Functionality for Investigators in R, I discovered a "tip of the iceberg" scenario. To that end, I'd like to revisit the concept with an additional discovery and opportunity. In reality, this is really a case of DFIR (Deeper Functionality for Investigators in R) within the general practice of the original and paramount DFIR (Digital Forensics/Incident Response).
As discussed here before, those of us in the DFIR practice, and Blue Teaming at large, are overwhelmed by data and scale. Success truly requires algorithmic methods. If you're not already invested here I have an immediately applicable case study for you in tidy anomaly detection with anomalize.
First, let me give credit where entirely due for the work that follows. Everything I discuss and provide is immediately derivative from Business Science (@bizScienc), specifically Matt Dancho (@mdancho84). He created anomalize, "a tidy anomaly detection algorithm that’s time-based (built on top of tibbletime) and scalable from one to many time series," when a client asked Business Science to build an open source anomaly detection algorithm that suited their needs. I'd say he responded beautifully, when his blogpost hit my radar via R-Bloggers it lived as an open tab in my browser for more than a month until generating this toolsmith. Please consider Matt's post a mandatory read as step one of the process here. I'll quote Matt specifically before shifting context: "Our client had a challenging problem: detecting anomalies in time series on daily or weekly data at scale. Anomalies indicate exceptional events, which could be increased web traffic in the marketing domain or a malfunctioning server in the IT domain. Regardless, it’s important to flag these unusual occurrences to ensure the business is running smoothly. One of the challenges was that the client deals with not one time series but thousands that need to be analyzed for these extreme events."
Key takeaway: Detecting anomalies in time series on daily or weekly data at scale. Anomalies indicate exceptional events.
Now shift context with me to security-specific events and incidents, as the pertain to security monitoring, incident response, and threat hunting. In my November 2017 post, recall that I discussed Time Series Regression with the Holt-Winters method and a focus on seasonality and trends. Unfortunately, I couldn't share the code for how we applied TSR, but pointed out alternate methods, including Seasonal and Trend Decomposition using Loess (STL):
- Handles any type of seasonality ~ can change over time
- Smoothness of the trend-cycle can also be controlled by the user
- Robust to outliers
Here now, Matt has created a means to immediately apply the STL method, along with the Twitter method (reference page), as part of his time_decompose() function, one of three functions specific to the anomalize package. In addition to time_decompose(), which separates the time series into seasonal, trend, and remainder components, anomalize includes:
- anomalize(): Applies anomaly detection methods to the remainder component.
- time_recompose(): Calculates limits that separate the “normal” data from the anomalies
The methods used in anomalize(), including IQR and GESD are described in Matt's reference page. Matt ultimately set out to build a scalable adaptation of Twitter's AnomalyDetection package in order to address his client's challenges in dealing with not one time series but thousands needing to be analyzed for extreme events. You'll note that Matt describes anomalize using a dataset of the daily download counts of the 15 tidyverse packages from CRAN, relevant as he leverages the tidyverse package. I initially toyed with tweaking Matt's demo to model downloads for security-specific R packages (yes, there are such things) from CRAN, including RAppArmor, net.security, securitytxt, and cymruservices, the latter two courtesy of Bob Rudis (@hrbrmstr) of our beloved Data-Driven Security: Analysis, Visualization and Dashboards. Alas, this was a mere rip and replace, and really didn't exhibit the use of anomalize in a deserving, varied, truly security-specific context. That said, I was able to generate immediate results doing so, as seen in Figure 1.
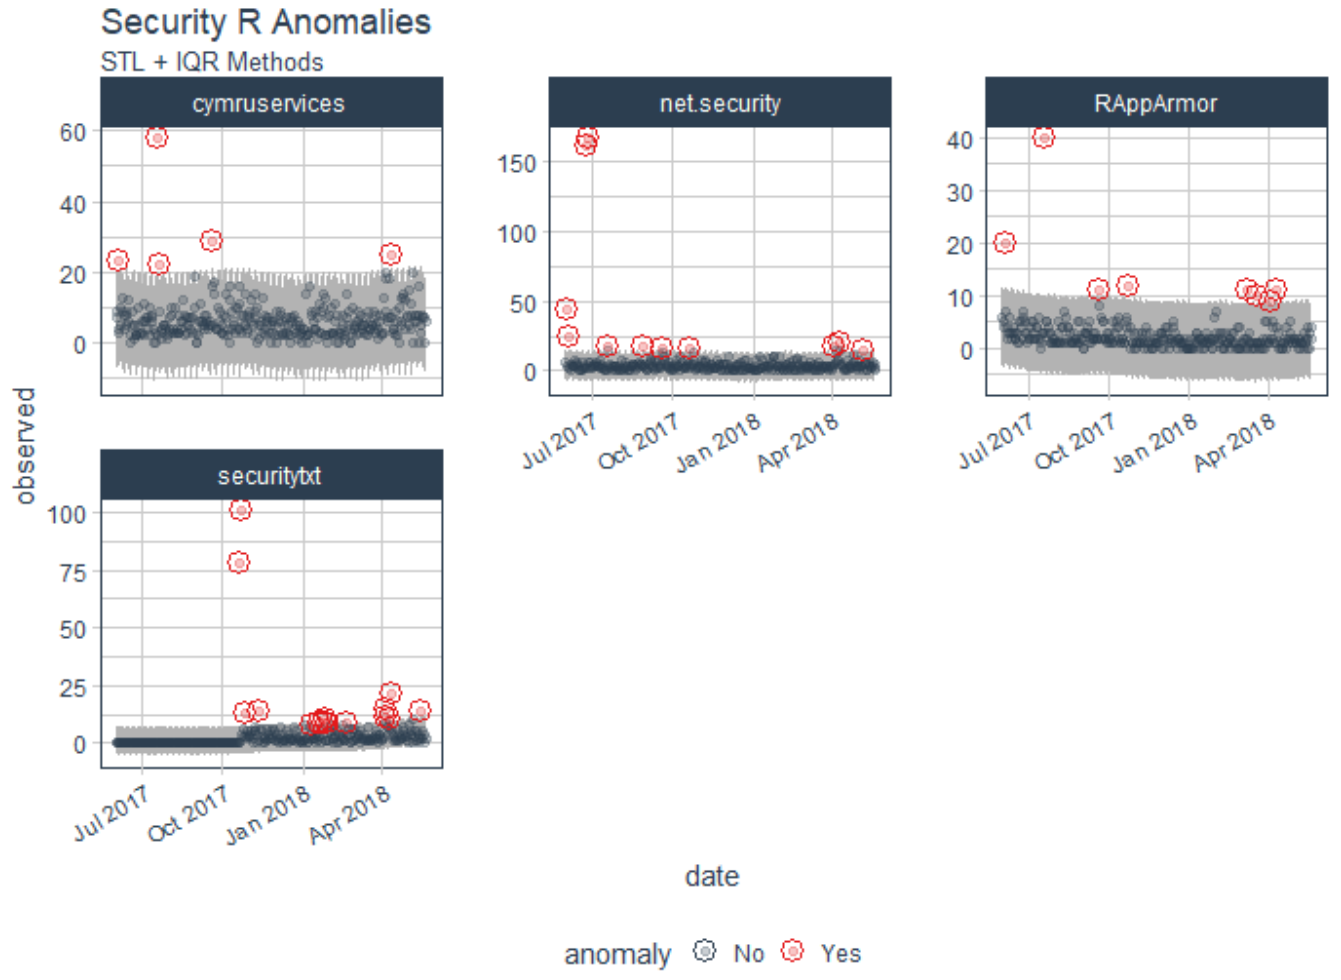
Figure 1: Initial experiment
As an initial experiment you can replace packages names with those of your choosing in tidyverse_cran_downloads.R, run it in R Studio, then tweak variable names and labels in the code per Matt's README page.
I wanted to run anomalize against a real security data scenario, so I went back to the dataset from the original DFIR articles where I'd utilized counts of 4624 Event IDs per day, per user, on a given set of servers. As utilized originally, I'd represented results specific to only one device and user, but herein is the beauty of anomalize. We can achieve quick results across multiple times series (multiple systems/users). This premise is but one of many where time series analysis and seasonality can be applied to security data.
I originally tried to write log data from log.csv straight to an anomalize.R script with logs = read_csv("log.csv") into a tibble (ready your troubles with tibbles jokes), which was not being parsed accurately, particularly time attributes. To correct this, from Matt's Github I grabbed tidyverse_cran_downloads.R, and modified it as follows:
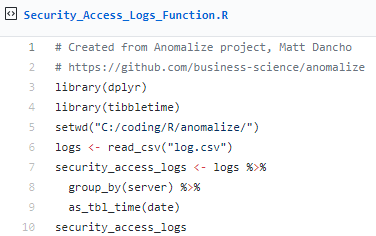
This helped greatly thanks to the tibbletime package, which is "is an extension that allows for the creation of time aware tibbles. Some immediate advantages of this include: the ability to perform time based subsetting on tibbles, quickly summarising and aggregating results by time periods. Guess what, Matt wrote tibbletime too. :-)
I then followed Matt's sequence as he posted on Business Science, but with my logs defined as a function in Security_Access_Logs_Function.R. Following, I'll give you the code snippets, as revised from Matt's examples, followed by their respective results specific to processing my Event ID 4624 daily count log.
First, let's summarize daily login counts across three servers over four months.
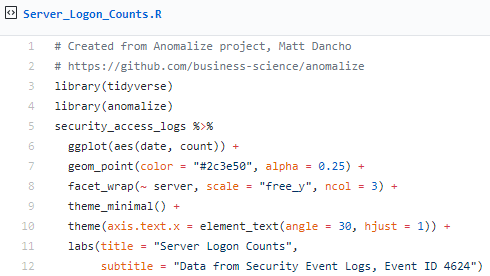
The result is evident in Figure 2.
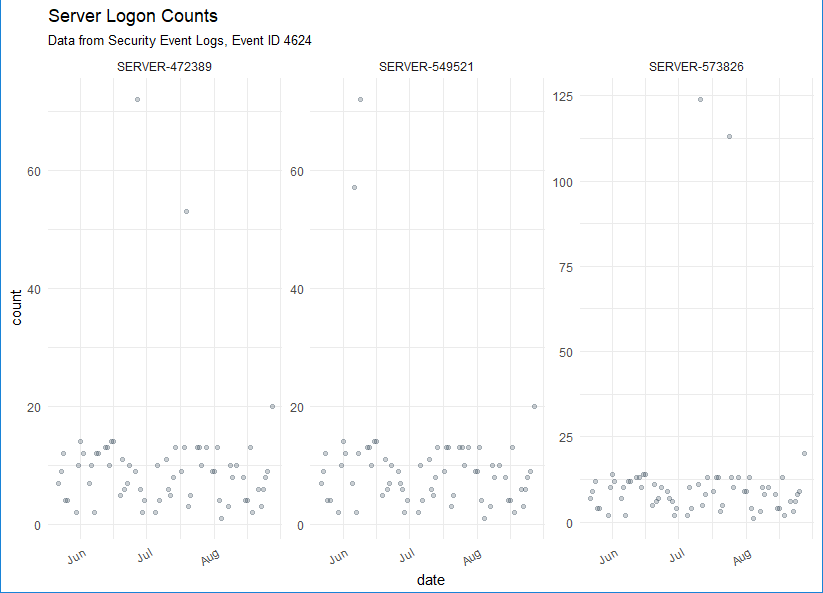
Figure 2: Server logon counts visualized
Next, let's determine which daily download logons are anomalous with Matt's three main functions, time_decompose(), anomalize(), and time_recompose(), along with the visualization function, plot_anomalies(), across the same three servers over four months.
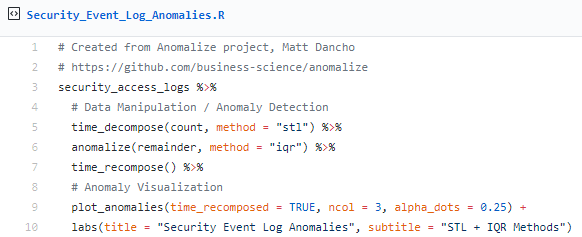
The result is revealed in Figure 3.
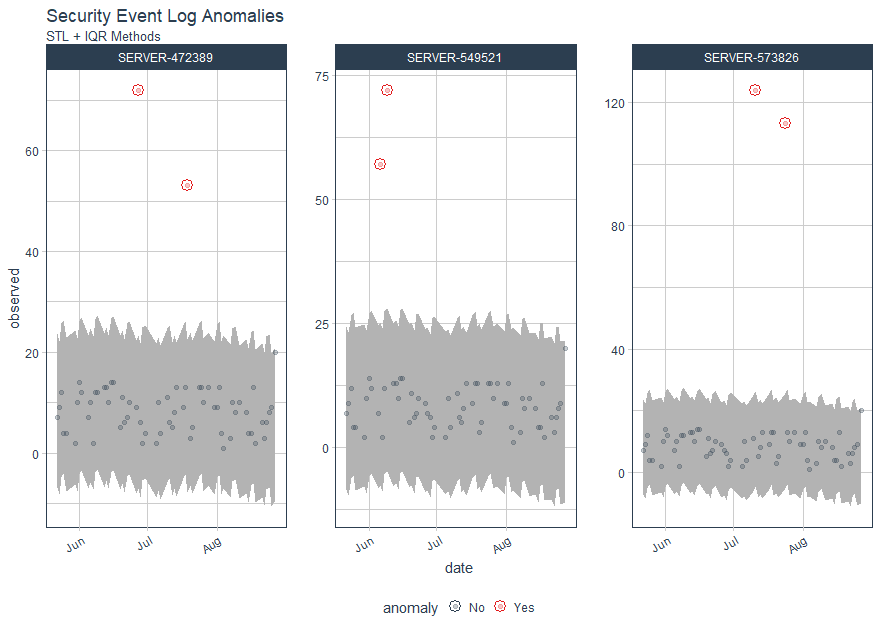
Figure 3: Security event log anomalies
Following Matt's method using Twitter’s AnomalyDetection package, combining time_decompose(method = "twitter") with anomalize(method = "gesd"), while adjusting the trend = "4 months" to adjust median spans, we'll focus only on SERVER-549521.
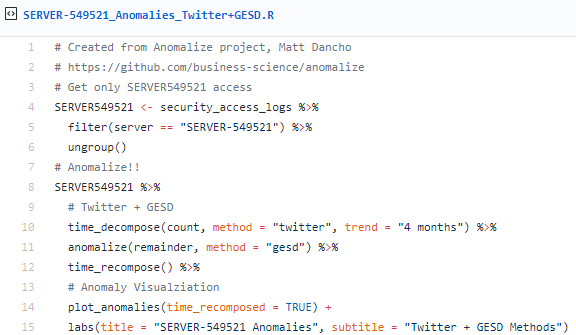
In Figure 4, you'll note that there are anomalous logon counts on SERVER-549521 in June.
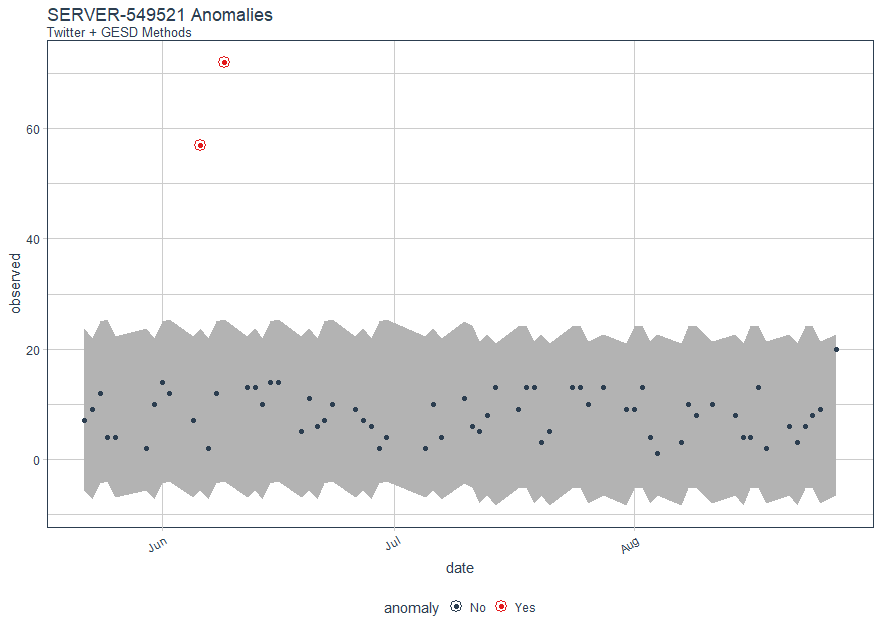
Figure 4: SERVER-549521 logon anomalies with Twitter & GESD methods
We can compare the Twitter (time_decompose) and GESD (anomalize) methods with the STL (time_decompose) and IQR (anomalize) methods, which use different decomposition and anomaly detection approaches.
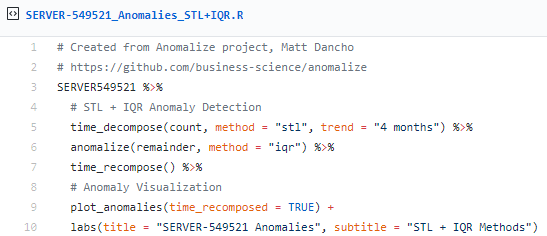
Again, we note anomalies in June, as seen in Figure 5.
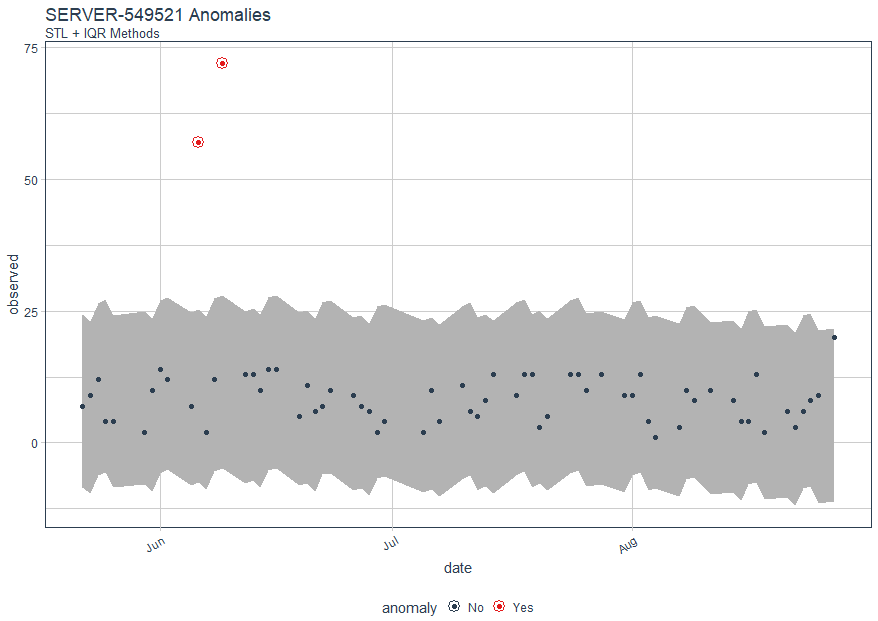
Figure 5: SERVER-549521 logon anomalies with STL & IQR methods
Obviously, the results are quite similar, as one would hope. Finally, let use Matt's plot_anomaly_decomposition() for visualizing the inner workings of how algorithm detects anomalies in the remainder for SERVER-549521.
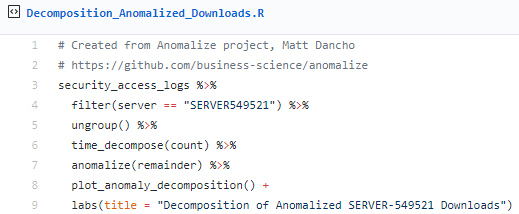
The result is a four part visualization, including observed, season, trend, and remainder as seen in Figure 6.
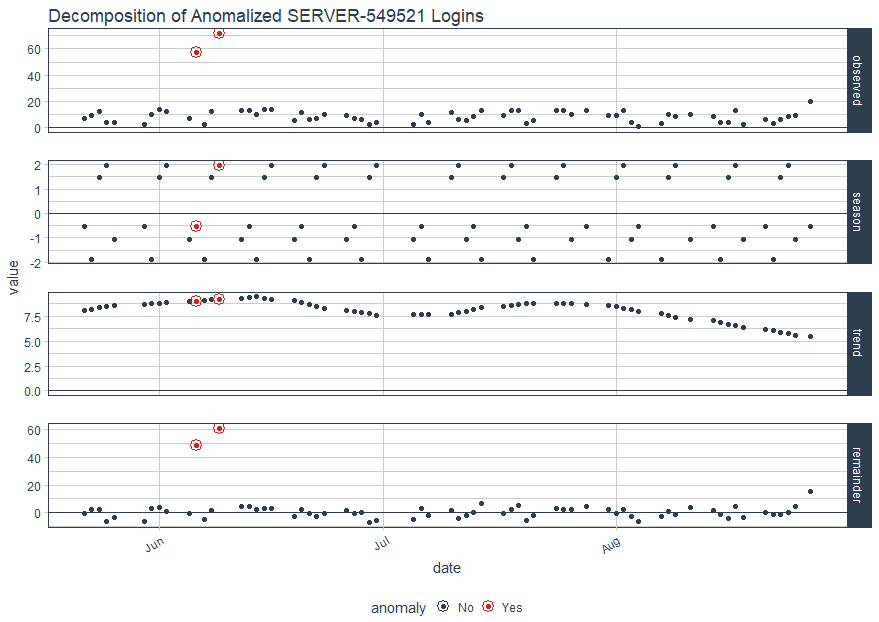
Figure 6: Decomposition for SERVER-549521 Logins
I'm really looking forward to putting these methods to use at a much larger scale, across a far broader event log dataset. I firmly assert that blue teams are already way behind in combating automated adversary tactics and problems of sheer scale, so...much...data. It's only with tactics such as Matt's anomalize, and others of its ilk, that defenders can hope to succeed. Be sure the watch Matt's YouTube video on anomalize, Business Science is building a series of videos in addition, so keep an eye out there and on their GitHub for more great work that we can apply a blue team/defender's context to.
All the code snippets are in my GitHubGist here, and the sample log file, a single R script, and a Jupyter Notebook are all available for you on my GitHub under toolsmith_r. I hope you find anomalize as exciting and useful as I have, great work by Matt, looking forward to see what's next from Business Science.
Cheers...until next time.


Comments