Multipurpose PCAP Analysis Tool
I was looking for a tool to easily graph traffic for a project (there are many out there) and while searching I found this tool written as a project by "[...] Daniel Botterill as part of his MSc Computer Security degree, it has been designed to take in a PCAP capture file and report back any malicious behaviour identified."[1]
This tool is packed with options (tabs) to analyze traffic in many different ways. There is two sample pcap files included in the MalwareAnalysis folder for testing the tool or you can use your own. I update two lists in BlocklistedAddresses\blocklists [3][4] folder before starting the tool for the first time. You can add any list you want which will need to be configured after you start the tool under the Analyzer Settings which I will come back later.
This tool is easy to use and requires Java to be installed in order to work. Download the package from here. It runs on Windows and Linux (I haven't tested it on Linux) and unzip it. There are 4 scripts available to copy (as admin) the correct windows version of jnetpcap.dll to %windir%\system32 or same process for libjnetpcap.so to the correct Linux library. To start the program after the initial installation, you can execute the MalWareAnalysis.jar file.
Now it is time to configure the tool before importing any packets. To configure the tool, select Options -> Analyzer Settings:
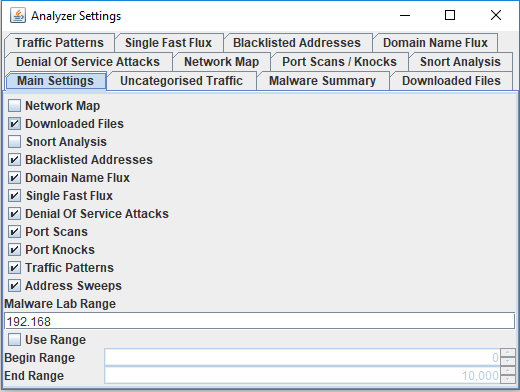
All the different options are displayed here. For example, I wanted a Network Map to display the traffic relationships and I checked the network map box before moving on to the Blocklisted Addresses tab and added the bt_spyware.txt list to my analyzer as this graph:

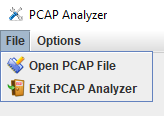
Next open and import a pcap file into the PCAP Analyzer:
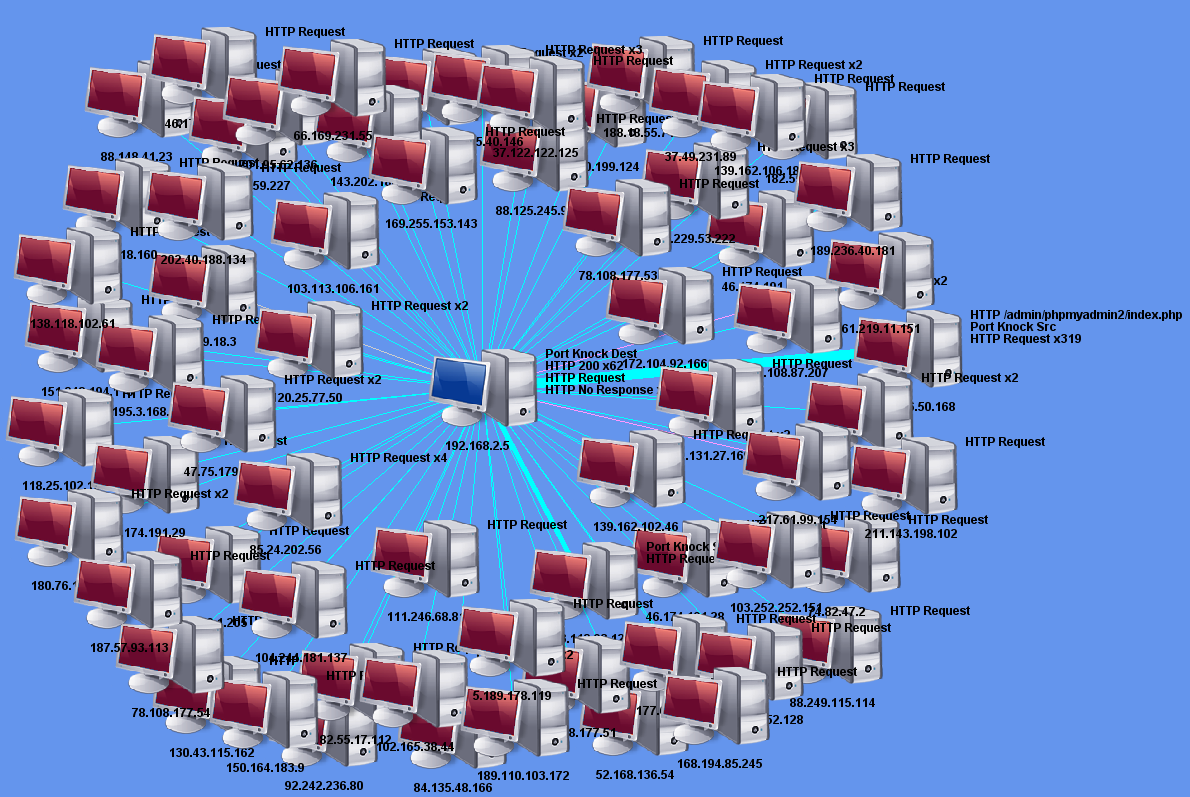
The pcap I picked contained all the web connections to my honeypot for the last 24 hours. I now go to the Network Map tab and check the traffic relationship between my honeypot (center 192.168.25.5) and the inbound connections to the web server. The graph shows how many attempts per IP and sometimes shows the URL. You can adjust the Network Map Layout (drop down from top) to view the IPs or move the icon around. You can see one of the source to the right requested various PHP scripts 319 times(only first one shown) against the honeypot. The thicker is the line, the more traffic between the hosts.
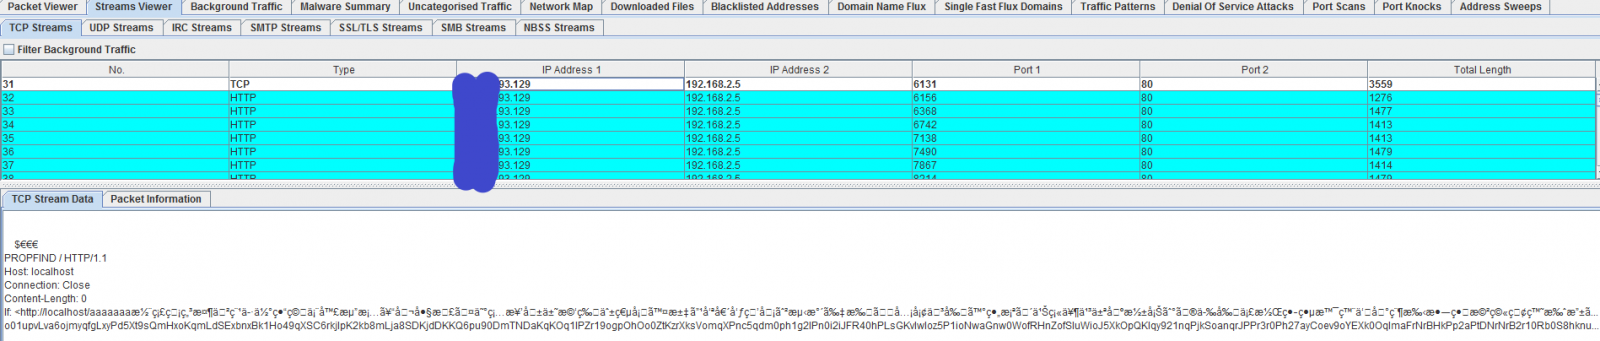
This one of the many features available. The last feature I am going to used is the Stream Viewer -> TCP Streams. Each packet can be selected to view the ASCII data (if readable)
It is not a replacement for Wireshark but has many of its features where some are easier and quicker to use and can be very useful as another tool to analyze traffic and its payload. There are so many more features I could talk about, you just have to test it for yourself if it should become part of your security set.
[1] http://www.cs.bham.ac.uk/~tpc/PCAP/
[2] http://www.cs.bham.ac.uk/~tpc/PCAP/MalwareAnalysis.zip
[3] https://zeustracker.abuse.ch/blocklist.php?download=domainblocklist
[4] https://www.iblocklist.com/lists
-----------
Guy Bruneau IPSS Inc.
Twitter: GuyBruneau
gbruneau at isc dot sans dot edu


Comments