Open redirects ... and why Phishers love them
Working from home, did you get a meeting invite recently that pointed to https://meet.google.com ? Well, that's indeed where Google's online meeting tool is located. But potentially the URL you got is not "only" leading you there.
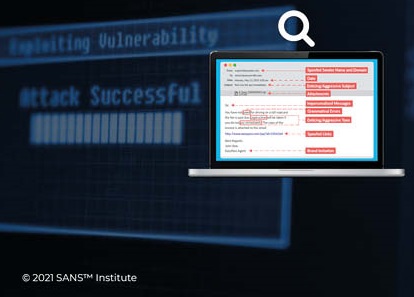
Google Meet and Google Hangouts have a so-called open-redirect vulnerability. Phishers have found it, and are currently abusing it in droves. Your users believe they are clicking on a Google link, but end up somewhere else alltogether.
Benign example: https://meet.google.com/linkredirect?dest=https://cwe.mitre.org/data/definitions/601.html
Obviously, the Phishers wont't send your users to the Mitre vulnerability database, but rather make use of obfuscated destination URLs which commonly then lead to a phishing site that mimics a Google or Microsoft login page.
Google Hangouts https://hangouts.google.com has the same problem, and is also being abused.
Battling the never ending Phishing wave is difficult enough without major companies providing help to the crooks in the form of Open Redirects. If you have open redirects in your online web presence, and they are turning up in vulnerability reports for your site, please take them seriously, and fix them.

Network Forensics on Azure VMs (Part #2)
In yesterday's diary, we took a look at two methods that allow to capture network connection information off a potentially compromised virtual machine in Azure. Today, we'll investigate the most recent addition to the VM monitoring arsenal, namely "Azure Monitor Insights".
"Insights" is enabled directly under the "Monitoring" menu tab of the corresponding VM. Deploying it can be done from within the Azure Portal, while a VM is running, and without having to log in on the VM itself. The solution deploys a Microsoft OMS monitoring agent into the VM though, so this isn't exactly stealthy either.
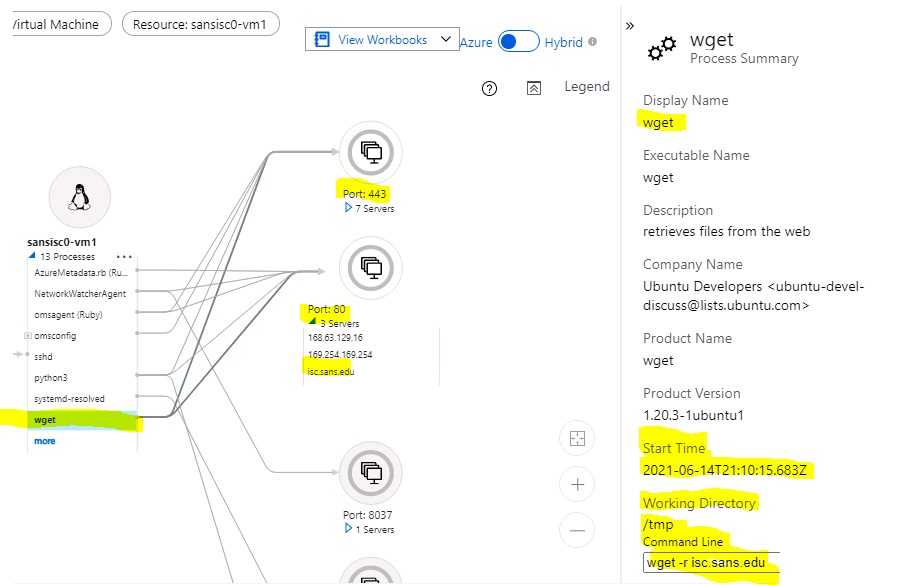
Unlike the two methods shown in yesterday's diary, "Insights" combines process telemetry from within the VM with network flow logs. The resulting charts are meant well, but get unwieldy very quickly. Behind the charts, there is though a lot of data that can be reached via click-through:

In this case, we can see that the process "wget" made connections on Port 80 and 443, and in the details pane, we can even see the start time, working directory, and the command line used.
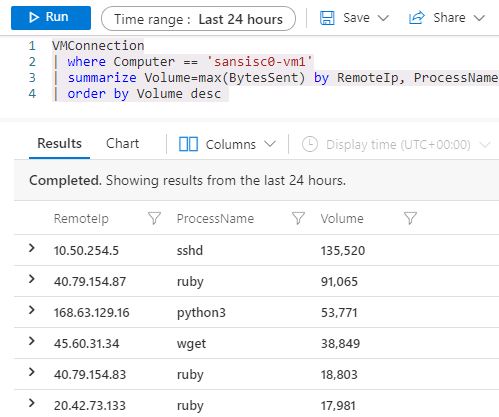
But wait, there's more. The "Insights" chart panel is just visualizing information that is also directly accessible, in the associated Azure Log Analytics container. With the right query in Kusto Query Language (KQL), we can search, combine, merge and dice directly on the logs themselves. This allows for example to quickly identify which process (if any) is leaking or uploading large volumes of data, and to where:
When you experiment with Insights for the first time, keep an eye on the related costs. The pricing model of Azure Monitor Insights is a bit unpredictable, and depends on the volume stored in the associated Log Analytics container. If you have a busy machine that generates a lot of log data, the "free" 5GB allotment in the current Pay-as-you-go pricing model can be used up quite quickly. See https://azure.microsoft.com/en-us/pricing/details/monitor/ for details.
If you have additional tips on how to conduct forensic network monitoring on Azure VMs, please let us know, or share in the comments below.


Comments