Is that It? Finding the Unknown: Correlations Between Honeypot Logs & PCAPs [Guest Diary]
[This is a Guest Diary by Joshua Jobe, an ISC intern as part of the SANS.edu BACS program]
Introduction
Upon starting the Internship in January 2024, I wondered how I was going to tackle analyzing all the logs, how to parse and understand JSON files, and make sense of the plethora of details to even try to make an attack observation. Where do the files go, how do we correlate the filenames with the hashes, what’s the deal with webhoneypot logs? During the Introductory Call, Mentor Handler, Guy Bruneau, mentioned the DShield SIEM [1] he has been working on for everyone to use to enhance the internship experience. I felt this was the perfect opportunity to build something that will assist with correlating the ‘attacks’ on the sensors by ingesting the logs into a SIEM. This is especially useful for those that want to see the details in a way that is more organized and easier to extrapolate data. However, simply reviewing activity in the SIEM may not always be enough to build a complete picture for an attack observation. Likewise, simply parsing through the logs may not always give you a complete picture either.
This blog post will walk through the steps I have taken to build a bigger picture to make an attack observation, briefly going over various attacks such as malicious files, HTTP requests, Cowrie/Webhoneypot JSON logs and PCAPs.
Where to Start
After initially setting up the DShield Honeypot (sensor), it will inevitably take 2-3 weeks or more to begin seeing attacks, especially any that may involve uploading/downloading files. Be patient. Interesting IP addresses, files, URLs, TTY logs, etc. will show up. It is imperative that you follow the instructions to properly expose your sensor or sensors to the internet.
For example, I am running two sensors behind an Asus RT-AC86U router, since this router doesn’t natively allow the same port entries when Port Forwarding two internal IP addresses, I opted to setup one sensor with only TCP ports 8000, 2222, 2223, 8443 open with the second sensor open to the entire port range: TCP/UDP 1:65535. Utilizing the demilitarized zone (DMZ) is not currently an option due to how my network is setup. The sensor with the entire port range open tends to see more traffic.
Once you have your sensors up and running, I highly recommend setting up the DShield SIEM previously mentioned. Here are some recommendations to consider for the SIEM:
- Physical system or VM – it is best to install this on a system you can leave running 24/7 and not use your primary laptop or PC. Using a dedicated system allows the SIEM to constantly ingest the files from the sensors with minimal delays in populating the details in Kibana. Occasional restarts and updates are expected, but they will be less frequent than if you use your primary system. I repurposed an old HP laptop with 8 GB of RAM specifically for this task and placed it next to the sensors.
- Hard Drive Space – Consider 300-500GB at minimum. This is critical to hash out ahead of time. The minimum recommended space for the Docker partition is 300GB, however, the more features you integrate (Arkime, Zeek, PCAP captures, etc), the quicker it will fill up. I started with 100GB thinking it would be plenty. I was wrong and within about a month and a half the SIEM wasn’t operating correctly due to not having enough space. Deleting non-critical data worked for about a week. I ended up adding a spare 1 TB external HDD, then expanded the volume group and logical volume to use the entire drive.
Now that the sensors are collecting data and the SIEM is ingesting the logs, you need to focus on what your first attack observation will be on.
SIEM Review and Correlation of File Uploads
After about 3 weeks, you should begin seeing quite a bit of interesting activity on the SIEM. Here are a few examples of what you may see:
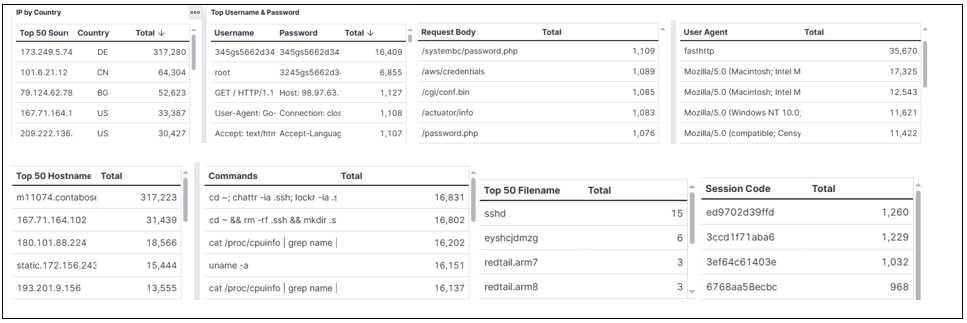
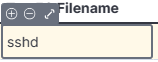
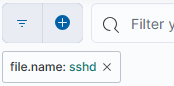
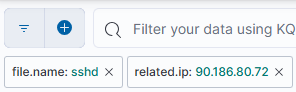
You have multiple options to focus your attention on. If you narrow your results by IP, you may see the associated Username & Passwords, any commands that were attempted, or perhaps filenames. If you filter by filename, you get the associated IP address or addresses along with all other data associated with just the filename. When filtering by any filter other than IP to find associated IP addresses, I recommend choosing an IP or multiple IP addresses to populate additional data specific to that IP. For example, if you want to find associated IP addresses for filename ‘sshd’, hover the cursor over the ‘Filename’ and select the + to add it as a filter near the top:
This filter results in the following IP addresses, Session Codes, and the associated SHA256 file hashes, among other information:
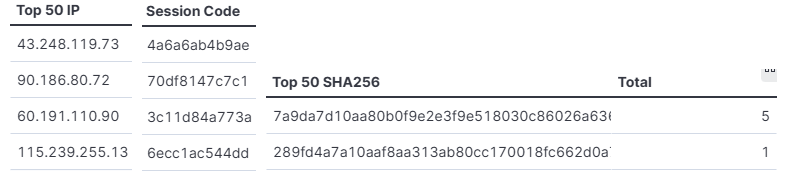
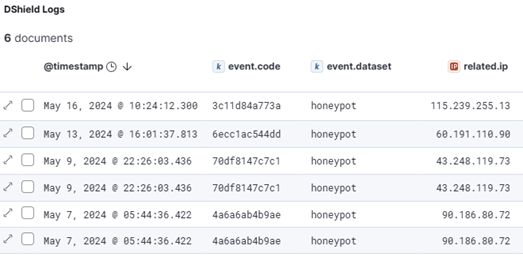 As you can see, filtering by ‘sshd’ identifies 4 IP addresses, associated sessions, and 2 different SHA256 hashes for the same filename. This also narrows down only the logs related to this filter:
You can further narrow down the results by either IP address or focus on a single hash. Let’s focus on a single IP address. Following the same example for filtering by filename, chose an IP address to filter on:
 This approach will narrow down the details specific to this IP address. Select the X to remove the ‘sshd’ filter. I recommend this approach to see if this IP address is associated with other activities, such as web requests.
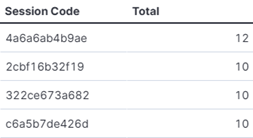
Filtering only a single IP, now reveals other Session details that you can further use to begin building an understanding of this threat actor.
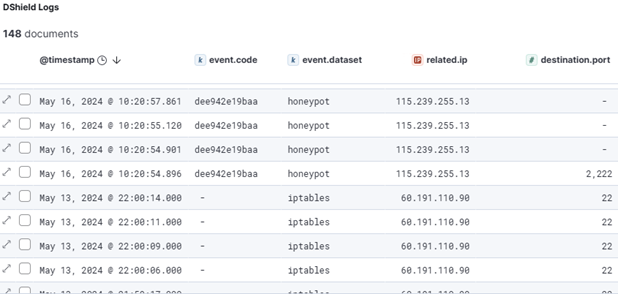
Using the single IP search also reveals related activity where 46 logs were recorded by the attempts of this threat actor: 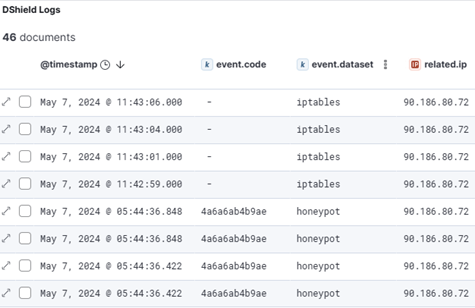
There are additional fields for this section of the SIEM, however, it is cut off for brevity. Additional fields include destination port, source user command, username and password fields, along with HTTP request body for any web requests.
If you want to find the related details for all the associated IP addresses for the ‘sshd’ file, use the search field to create the expanded filter:

Other than what we’ve already covered, filtering using this search criteria will reveal all associated sessions and other interactions applicable to just those IP addresses. In this example, there are 148 entries related to these IP addresses:
For the most part, observations that relate to files uploaded to a honeypot, the SIEM is about all I need. Reviewing the cowrie JSON logs pulls everything with all relevant details for each IP address into a format I feel is a bit easier to follow. Some data may not always populate on the SIEM, so it isn’t a bad idea to review the logs from the honeypot to confirm.
For Attack Observations related to malicious files, use VirusTotal to check the file hash and decide if it’s worth investigating further using other sandboxes such as Cuckoo Sandbox [2] or Joe Sandbox Cloud [3], among others. Alternatively, using a virtual machine (VM) to perform various types of malware analysis may reveal details not reported on using automatic malware analysis.
HTTP Requests
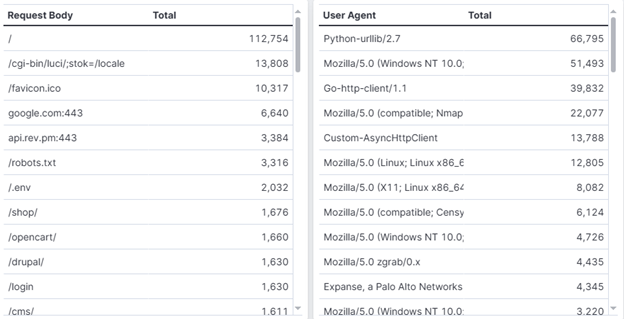
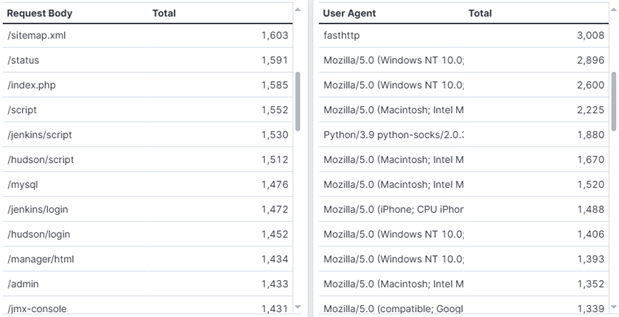
One of the great things about using the SIEM is that you get a quick, upfront view of all the interactions happening on your sensor or sensors. You could also parse through the logs manually to get similar data. However, one thing that I just couldn’t wrap my head around is what is so special about these web requests? Sure, we can Google the URLs, perhaps find CVEs or other sources related to a URL. You might even be able to find vulnerable systems open on the internet. For me, reviewing these requests on the SIEM or parsing through the logs still didn’t answer why. Here is an example of web requests and user agents you might see on the SIEM to decide what you want to focus on:
Just like narrowing down results from potentially malicious files, we can do the same with the requests on the web interface of the SIEM to find the related IPs and other details. Something I didn’t point out before is that the SIEM includes features to facilitate gathering information on a threat actor from CyberGordon, Censys, Shodan, or internally using Cont3xt:
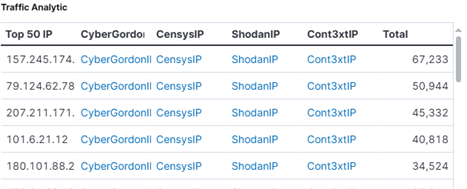
By narrowing down interesting files or web requests, you can use this section to visit the applicable websites for more information. It is just an easier way of clicking and viewing details about that IP address.
Since the SIEM wasn’t cutting it for me with web requests, I turned to the logs from the sensors to manually parse. However, as I will expand on in the last section, neither was really answering my question of what is making these requests so special. But first, let’s turn to the logs.
Log Reviews from the DShield Sensor
Parsing the logs reveals a lot of details about an IP address or even web requests. When I first started learning how to parse the JSON logs, I used both ChatGPT and an article from DigitalOcean called “How To Transform JSON Data with jq” [4]. Once you understand the structure of the JSON files, it is simple to parse the logs based on just about any search criteria. To parse Telnet/SSH logs based on an IP address, you can use these commands:
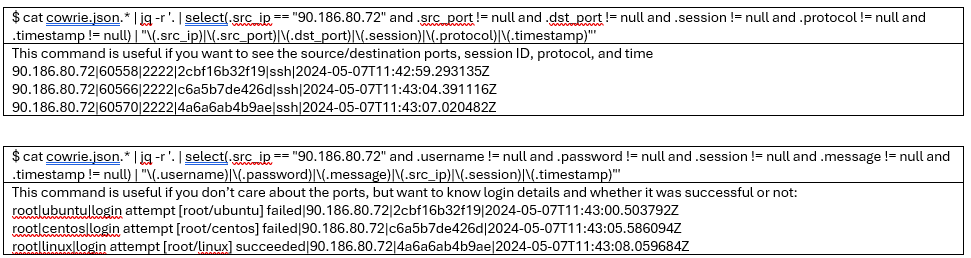
There are a lot more details that can be pulled out, but you also must know what that log contains to know what the structure is. Use the following command to parse the first object containing all the associated key-value pairs:

As an alternative to running the above commands, I decided to create a Python script to automate this approach to extract details I felt at the time to contain the details I wanted to focus on. [5]
I maintain two sensors, which automatically transfer copies of logged data to separate folders, daily. The script is in its own directory, so the file paths are relative to the script's location. Additionally, users have the flexibility to filter data either by IP address or Session ID. This is where the DShield SIEM proves invaluable. Users can first identify interesting data points, then further refine their search based on either IP address or Session ID:
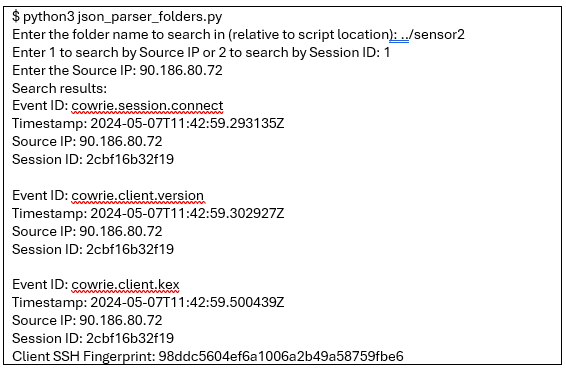
For the sake of space, I only copied a portion of the results. The output above also has data for all related sessions associated with that IP address.
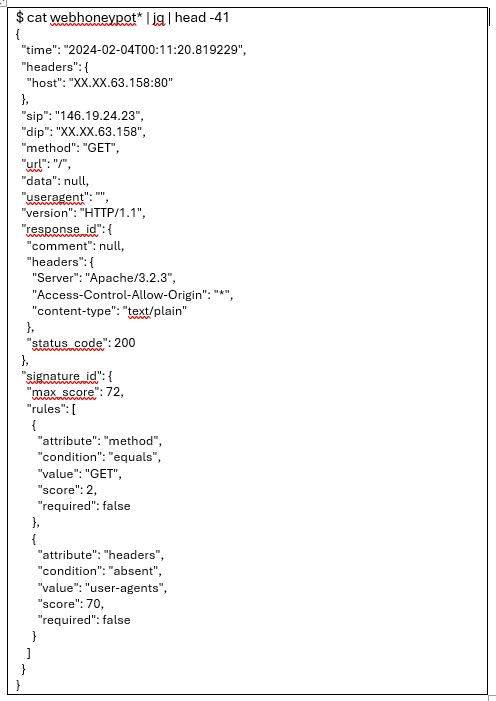
When it comes to the webhoneypot logs, the process is similar, but the details will be different as the object and key-value pairs will be different. Here is an example output of the webhoneypot logs:
The webhoneypot logs contain a lot of data. Most, in my opinion, aren’t applicable to the details I would like to see. Aside from manually parsing the files like the TELNET/SSH logs, I created a script specific to the format for these logs [5]. This gives a bit of flexibility for what you want to search for and whether you want to include any URLs that only begin with a forward slash “/”. Depending on what you are searching for, the search could return hundreds of resulting logs. For this reason, the script saves the results to a file, which also allows it to run faster. Here is an example of running the script, then a partial output of the file:
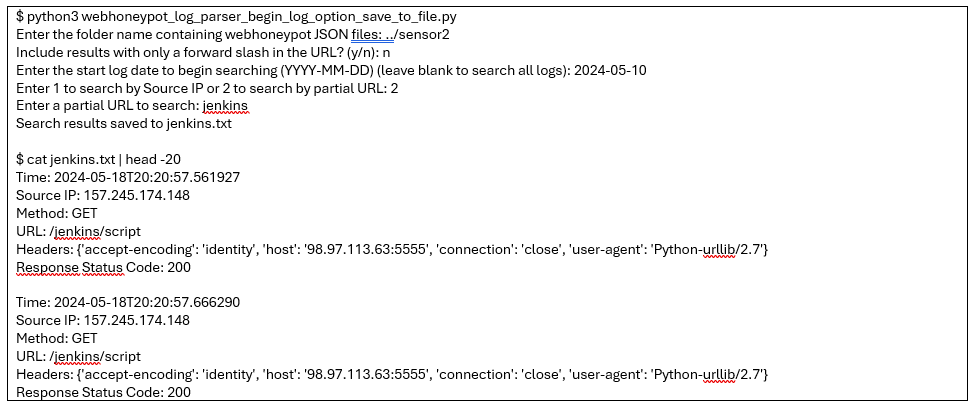
The partial URL search is useful if you notice multiple URLs that contain a subdirectory in the path such as /jenkins/script and /jenkins/login.
While the web logs provide a lot of details, this goes back to what I mentioned earlier about something still seemed to be missing and answering the question of why these are being accessed. This is where the PCAPs in the next section come into play.
Why You Should Use PCAPs
Having a honeypot running provides only so much insight into what a threat actor is doing just by reviewing the logs. However, it wasn’t until I decided to focus an attack observation based upon the web requests that I realized something is missing. If you haven’t decided to collect PCAPs up to this point, I highly recommend evaluating options to automatically collect them daily. One option is using Daemonlogger by following the instructions provided by Mr. Bruneau’s DShield SIEM setup on Github [1] or finding a solution that works best for you.
What you don’t get with the web logs from the honeypot is any inclination of what the threat actor may be doing – at least not from what I was able to observe. For example, a path stood out to me that had over 500 requests to /cgi-bin/nas_sharing.cgi. If you aren’t familiar with cgi-bin, it is often found on routers and other network devices such as NAS (network attached storage) devices from manufacturers such as Linksys, D-Link, Netgear, QNAP, Synology, etc. A vulnerability in a path such as this is enticing to the actor as you will see in a moment.
After you have narrowed down an attack observation, found a URL path, and further reviewed the logs, you also narrowed down the dates to focus on. Going back to how Daemonlogger is setup, it logs one PCAP file to a daily folder. This makes it easy to go directly to the PCAP that will have the traffic of the URL to investigate further. Taking the example of the /cgi-bin/nas_sharing.cgi, I reviewed PCAPs between 15-24 Apr 2024. This is what I discovered that made these web requests even more interesting:
Remote Code Execution (RCE):

Parsing through the honeypot logs, I couldn’t find any correlation of that command. The threat actor is using obfuscation to attempt to hide what they are doing by encoding the command into Base64. Decoding the encoded string reveals the following:

With this information, you can build a rather thorough attack observation, having more data than simply a web request and researching the vulnerabilities associated with those file paths.
Here is one more HTTP request to highlight why you should capture network traffic on the sensor:

Without it, all you would find in the logs is that the HTTP request method is POST and URL is /device.rsp along with other associated data.
Final Thoughts
If you didn’t catch the details regarding data retention on the sensor at the start of the internship, the logs are deleted at certain intervals. If you want to retain logs, set up an automatic way to transfer the logs to a separate system or a separate folder on the sensor. My first or second attack observation included some logs that just so happen to be at the tail end of when they are deleted. Fortunately, I had copies of the data, but I was relying on the details within the sensor. When I went to parse the data again the next day, it was gone. So, if you want long-term data retention for any of the logs, transfer the logs to another folder or system.
I can’t reiterate it enough about the importance of capturing network traffic on the sensor. The first month or so I hadn’t considered it. After I started capturing the traffic, I rarely reviewed the PCAPs as most of the data I was looking at was encrypted traffic from the file uploads. However, when it came to the web requests, this proved to be invaluable information.
From observing the DShield SIEM to manually parsing the logs, find what works best for you and take time to review the data, extract interesting information, and develop the attack observation report over a few days.
[1] https://github.com/bruneaug/DShield-SIEM
[2] https://malwr.ee/
[3] https://www.joesandbox.com/
[4] https://www.digitalocean.com/community/tutorials/how-to-transform-json-data-with-jq
[5] https://github.com/jrjobe/DShield-Cowrie-json-Parser
[6] https://www.sans.edu/cyber-security-programs/bachelors-degree/
A few portions of this post were aided with the assistance of ChatGPT, most content is original - https://chatgpt.com/
-----------
Guy Bruneau IPSS Inc.
My Handler Page
Twitter: GuyBruneau
gbruneau at isc dot sans dot edu


Comments