Latest Release of rockNSM 2.1
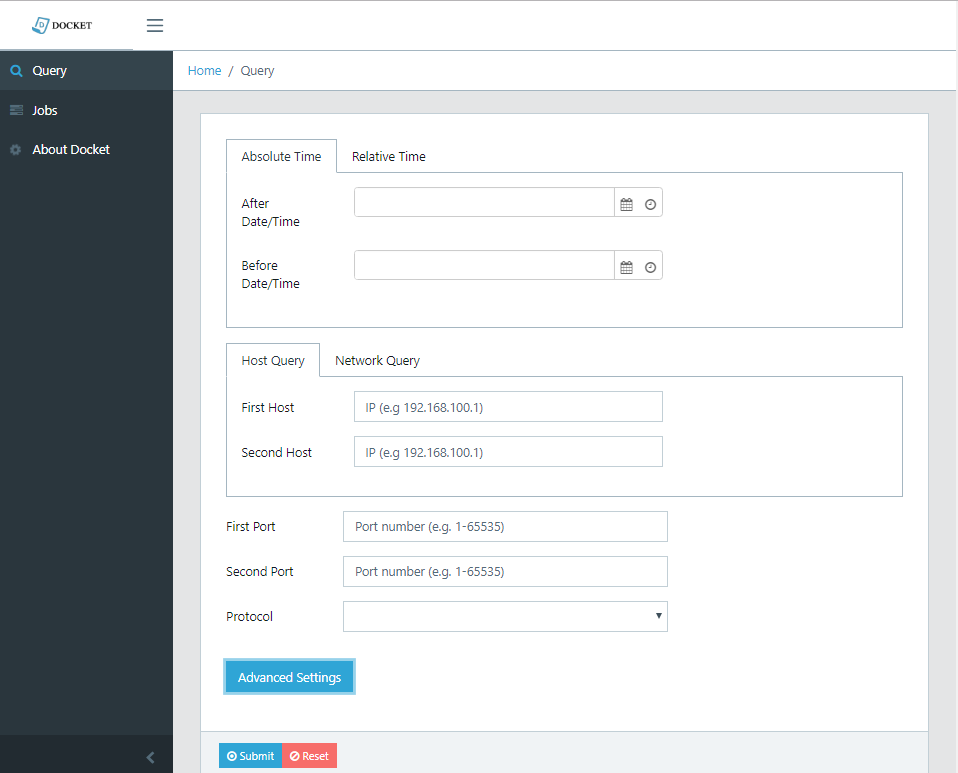
A year ago I published a diary on rockNSM[4] and its capabilities. If you are a fan of rockNSM[3], the latest GA release was made available on 23 Aug 2018. This latest release has the latest version of Elastic Stack, Elastic Basic, Kibana with options to capture other types of data. It has a new built-in web interface (Docket) with an API to retrieve packets captured by stenographer, as well as the latest packages to collect metadata with Bro, IDS with Suricata, etc.
During the installation of rockNSM, you see a banner advertising CAPESstack[6] as a collaboration tool for chat, Incident Response, Beats for performance and health metrics, CyberChef for analysis, etc. These tools are used for intelligence analysis and hunting running on a separate CenOS 7 server.
The installation on CentOS 7.5 is still straight forward. If you are new to rockNSM or Intrusion Detection, the Rock Team has released 3 educational YouTube videos to get you started. The latest version of rockNSM can be downloaded here. I have updated the steps I used to install and configure rockNSM here and the rockNSM Guide here.
rockNSM interface is much the same as before except for Kibana that now has additional options to collect performance metrics, log data or OS or services metrics from servers and Netflow data.
If you feel like a beta tester, rockNSM releases daily updates here.
[1] https://download.rocknsm.io/rocknsm-2.1.0.iso
[2] https://rocknsm.gitbooks.io/rocknsm-guide/build/
[3] https://blog.rocknsm.io/rocknsm-2-1-release-announcement-2fa36f270db4
[4] https://isc.sans.edu/forums/diary/rockNSM+as+a+Incident+Response+Package/22832/
[5] https://www.youtube.com/channel/UCUD0VHMKqPkdnJshsngZq9Q/videos
[6] http://capesstack.io/
[7] https://rocknsm.gitbooks.io/rocknsm-guide/content/
[8] http://mirror.rocknsm.io/pulp/isos/rocknsm-nightly
-----------
Guy Bruneau IPSS Inc.
Twitter: GuyBruneau
gbruneau at isc dot sans dot edu


Comments
I made a quick video of the first incarnation a few years ago:
https://www.minds.com/media/696144348571508754?referrer=linuxgeek
Kibana has made it super simple to make canned searches to find malicious stuff (not to mention using their visualizations to make "weird" poke you in the eye - grin). For instance, for a while there I was finding phishers with a collection of simple kibana queries like:
type:mail AND (fromDomain:*.fedex.com AND NOT srcHost:*.fedex.com)
or...
type:mail AND fromDomain:(*apple* *itunes*) AND srcHost:*.google.com (this phisher targeted our Japan offices)
Anonymous
Oct 9th 2018
6 years ago