The easy way to analyze huge amounts of PCAP data
When you are investigating a security incident, there are chances that, at a certain point, you will have to dive into network traffic analysis. If you’re lucky, you’ll have access to a network capture. Approximatively one year ago, I wrote a quick diary[1] to explain how to implement a simple FPC or “Full Packet Capture” solution based on a Docker container. It’s nice to capture all the traffic in PCAP files but then? PCAP files are not convenient to process and they consume a lot of disk space (depending on the captured traffic of course).
The next step is to have a tool ready to use to inspect the network traffic at any time. I tested multiple tools but my favourite one remains: Moloch[2]. It is a very good candidate to achieve this task: It helps you to capture traffic (optional), store/index flows in a database (at large scale because based on ElasticSearch) and, of course, search them. I’m also using Docker containers to run Moloch and ElasticSearch because they can be quickly deployed to investigate any PCAP even while on the road. They are two nice containers ready to use[3][4]. To deploy them, I use the following commands:
# docker run -d --name elasticsearch -v /data/elasticsearch:/usr/share/elasticsearch/data elasticsearch:5.2.2-alpine
# docker run -d --name moloch --link elasticsearch:elasticsearch -p 8005:8005 -v /data/tcpdump:/data/pcap:rw danielguerra/docker-moloch
Replace </data/elasticsearch> and <data/tcpdump> with your local directories that will contain, respectively, the ElasticSearch data and PCAP files to analyse.
By default, Moloch can sniff traffic passing by the default configured interface (eth0) but this is not possible with the Docker. If you configure the docker to have access to the local network resources (via ‘—net=host’), you won’t be able to access ElasticSearch. I’m using Moloch in two cases: during one-shot investigations (PCAP files provided by third-parties) or analysis of my own traffic. To achieve this, Moloch provides a nice tool called moloch-capture to ingest PCAP files.
In the first case, just process the provided PCAP file:
# docker exec -it moloch moloch-capture -r /data/pcap/evidence.pcap -t case_CUSTOMER_caseNO_YYYYMMYY
The tag (-t) is useful to search for packets related to a specific investigation.
In the second case, you must process new PCAP files when they are created:
# docker run -d --name moloch --link elasticsearch:elasticsearch -p 8005:8005 -v /data/tcpdump:/data/pcap:rw danielguerra/docker-moloch capture -m -R /data/pcap
Now, it will watch the directory /data/pcap for new “closed” PCAP files and index them. I would recommend you to use a tcpdump command like this:
/usr/sbin/tcpdump -i p1p1 -s 0 -G 1800 -W 96 -w /data/tcpdump/dump-%Y%m%d%H%M.pcap
tcpdump will create a new PCAP file every 1800" (30 mins) and keep an history of 96 * 30 mins (2 days).
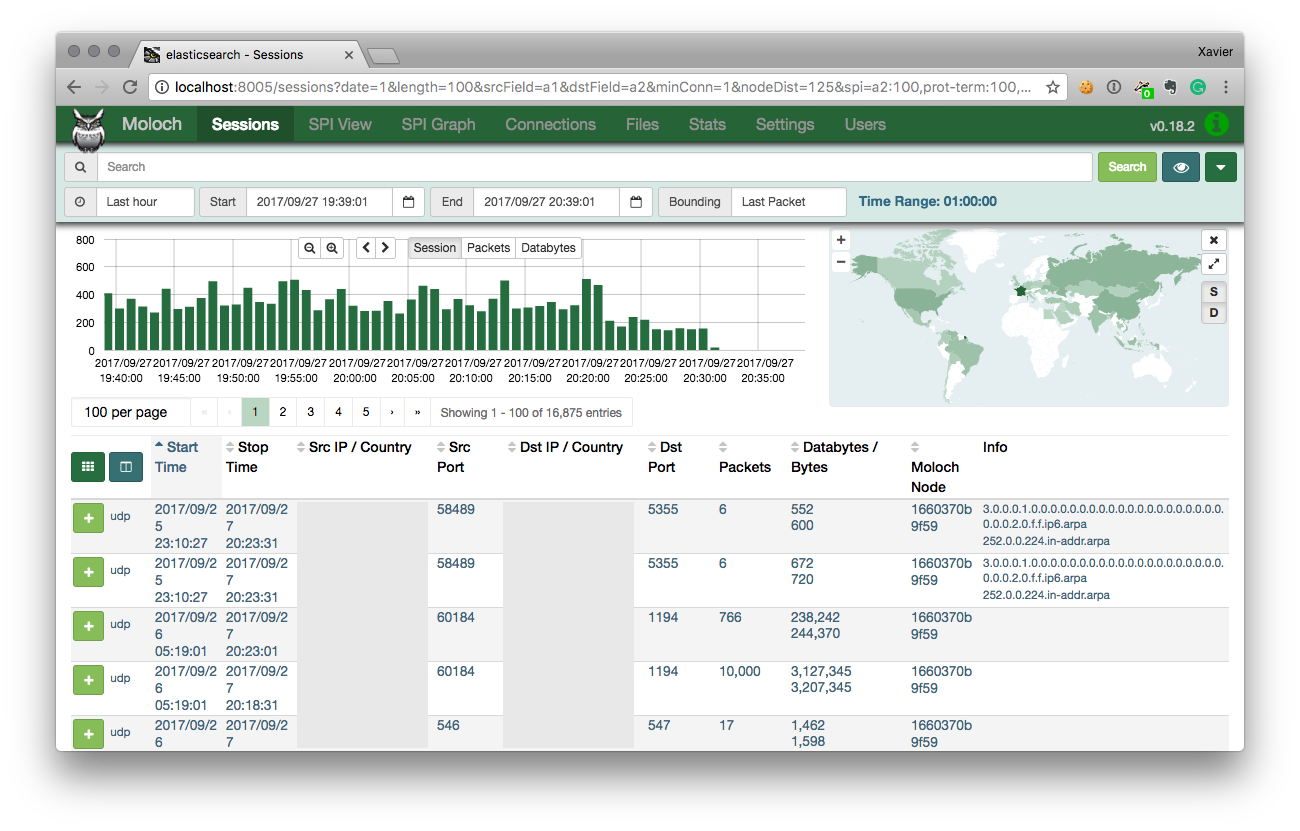
Moloch is available through port 8005 and provides a nice interface:
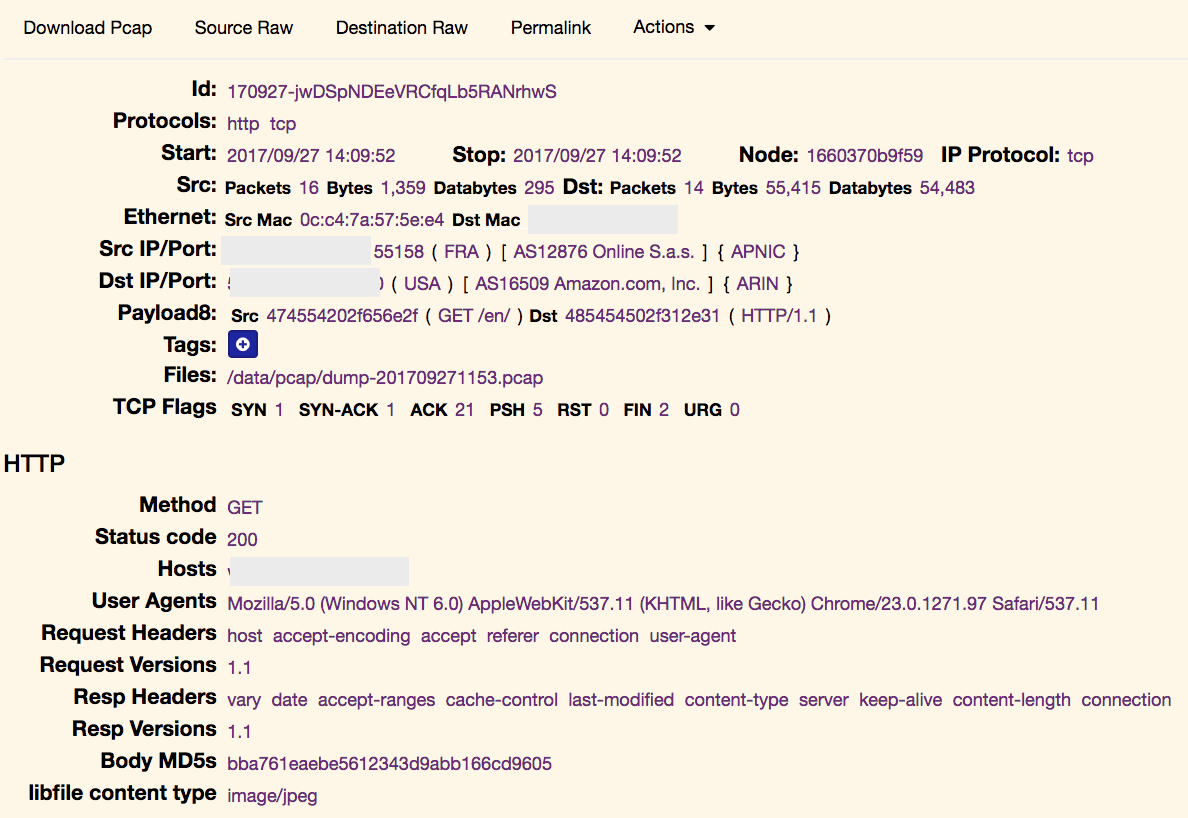
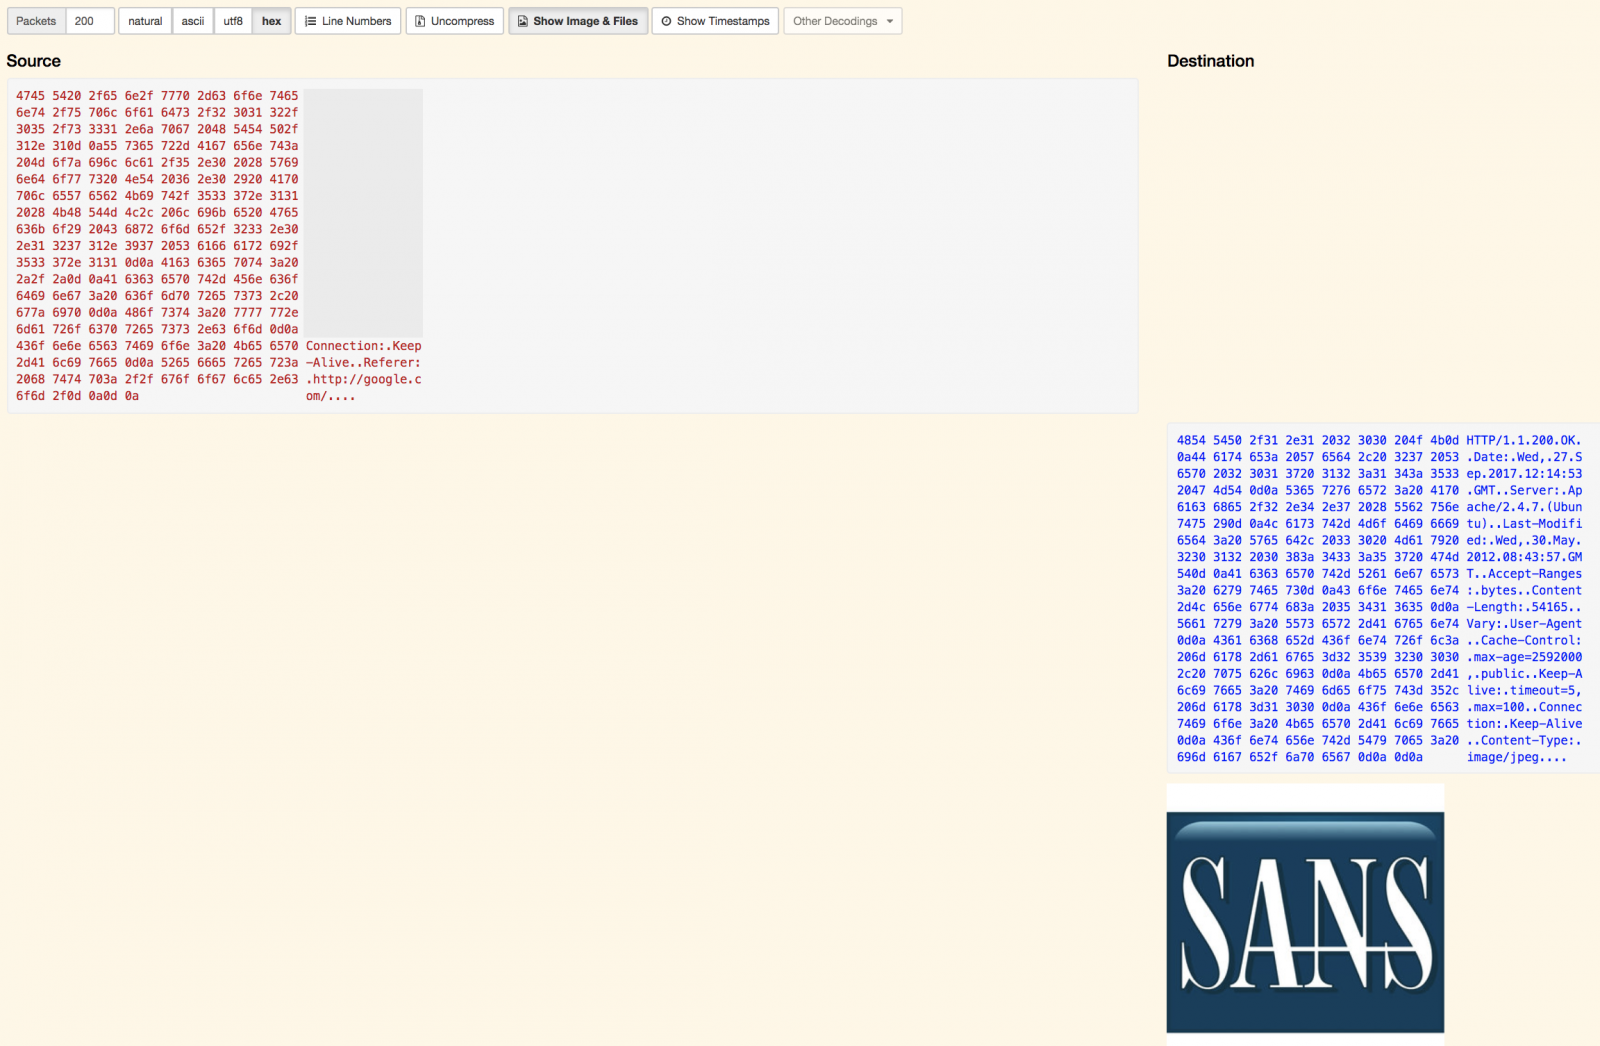
It’s easy to analyse in deep protocols and extract interesting information like files from HTTP flows from the TCP headers up to the data present at the application layer:
All data being indexed in an ElasticSearch instance, you can build nice queries to search for specific pieces of information. Examples:
protocols == dns && host.dns == /.*\.top/
port.dst == 80 && http.uri == /.*admin.*/
Other features that I like:
- You can also add tags to interesting flows for further references or to share with other analysts.
- You can generate a permalink to give access to a specific flow to your colleagues
- You can re-export interesting flows in other PCAP files
What about building a distributed full packet capture? Let’s imagine that you have hosts with sniffing capabilities on your network. If you run the initial Docker container to collect PCAP files via those hosts, you can send them to the central Moloch server with a simple cron job like:
find /data/tcpdump -name “*.pcap” -mmin 5 -print | while read PCAP
do
    scp $PCAP moloch-server:/data/pcap
done
Files will be stored in the central repository and made available for moloch-capture, which will automatically index them. Once indexed, you don't need to keep the original PCAP files and ElasticSearch will take care of the long-term retention.
Happy sniffing!
[1] https://isc.sans.edu/forums/diary/Full+Packet+Capture+for+Dummies/21679
[2] http://molo.ch/
[3] https://www.elastic.co/guide/en/elasticsearch/reference/current/docker.html
[4] https://github.com/danielguerra69/docker-moloch
Xavier Mertens (@xme)
ISC Handler - Freelance Security Consultant
PGP Key
| Reverse-Engineering Malware: Advanced Code Analysis | Online | Greenwich Mean Time | Oct 27th - Oct 31st 2025 |


Comments
A couple of notes:
I had major problems (JAVA stack traces and whatnot) with the Docker container elasticsearch:5.2.2-alpine. It started up, then crashed.
"docker logs ..." showed some nasty Java stack trace. In the end I gave up on this and used just the container "elasticsearch".
This seems to map to 5.5.2 on https://hub.docker.com/_/elasticsearch/. Please note, this image is marked as "deprecated".
It is not adviseable just to run "/usr/sbin/tcpdump -i p1p1 -s 0 -G 1800 -W 96 -w /data/tcpdump/dump-%Y%m%d%H%M.pcap"
- as this requires root-privileges. There are two solutions to this problem:
1) Run "tshark" instead - careful, not to install the GUI on a server. Most distributions offer a "wireshark-cli" package. Then grant Linux capabilities
via "setcap 'CAP_NET_RAW+eip CAP_NET_ADMIN+eip' /usr/sbin/dumpcap". Voila! And you can run it as non-root.
2) Run tcpdump with "--relinquish-privileges=$USER" to drop to a non-priviledged user.
The parameters for tshark are slightly different with tshark, but you can achieve the same.
Thanks
Thomas
Anonymous
Sep 28th 2017
7 years ago
Regarding the Elasticsearch docker, mine seems stable. But we all know that Dockers containers can be very sensitive to versions etc... :)
Anonymous
Sep 28th 2017
7 years ago
Anonymous
Sep 28th 2017
7 years ago
-v /data/elasticsearch:/usr/share/elasticsearch/data
Anonymous
Sep 29th 2017
7 years ago