A few Ghidra tips for IDA users, part 1 - the decompiler/unreachable code
As I continue to explore NSA's new reversing tool, Ghidra, one of the features that I heard about and was excited to see in action was the decompiler. So, in this entry in the series, I'll start to delve into that some. In particular, I'll look at one particular option that turned out to be more useful than I originally thought, though I'm still not entirely certain how I'll use it going forward. I've long been a user of the Hex-Rays decompiler at $dayjob and I really like it, but I can't afford it for use in my personal/Storm Center research and we don't use it in FOR610, so I was really looking forward to giving the Ghidra one a try. I have to say, so far, I'm pretty impressed. As I explain to my FOR610 students, decompiling is a hard problem. A lot of context is lost during optimization, so except for very simple programs you shouldn't expect the decompiler to give you C code that looks like the original source. Having said that, for someone like me who has been programming on-and-off for a very long time, I can usually grasp the purpose of a function much more quickly in a (pseudo-)high level language than I can in assembler. One place decompiling is extremely useful for, is showing the parameters to function calls (especially Windows API calls) in a way that isn't as tedious (and potentially error prone) as scrolling up and counting the PUSH instructions (cdecl or stdcall) or trying to trace the contents of certain registers (fastcall). More on that in my next installment.
The way the user interface in the Ghidra CodeBrowser works by default, in the center of the screen you have the disassembler window and immediately to the right of that is the decompiler window. When you are looking at code within a function in the disassembler, you'll see the corresponding decompiled code right next to it. If you click on an instruction in one, it highlights the corresponding code in the other in yellow. Very nice. But this also led to some confusion on one of the first samples I looked at in Ghidra.
In my normal workflow in IDA, I'll often begin by looking at the imports. In IDA, that means going to the imports tab where all of the imports are listed together. In Ghidra, the imports are all listed under the DLL from which they are imported. If I want to search through all of them, that requires clicking the + next to 'Imports' and then the + next to each of the DLLs. That is kind of a pain, but doable. If I have a particular API call that I want to look at (perhaps based on behavioral analysis), you can type that in the Filter box, just like you can type the API call name in the IDA imports window, so that's good. So when I took one of the samples we examine in FOR610 and examined it in Ghidra, I looked for one of the API calls (in this case, RegOpenKeyExA), and just like in IDA, I right-clicked on the name and looked for references (I'm half-tempted to change the key binding so that I can use 'x' just like in IDA, rather than the 'ctrl-shift-F' that is the Ghidra default, since I'm so used to it, but maybe I'll adjust). I clicked on one of the calls and I see the call in the disassembler window, but when I look over at the decompiler window, I can't find it. I try clicking on other instructions around the call and nothing is getting highlighted in the decompiler window. What the ****?

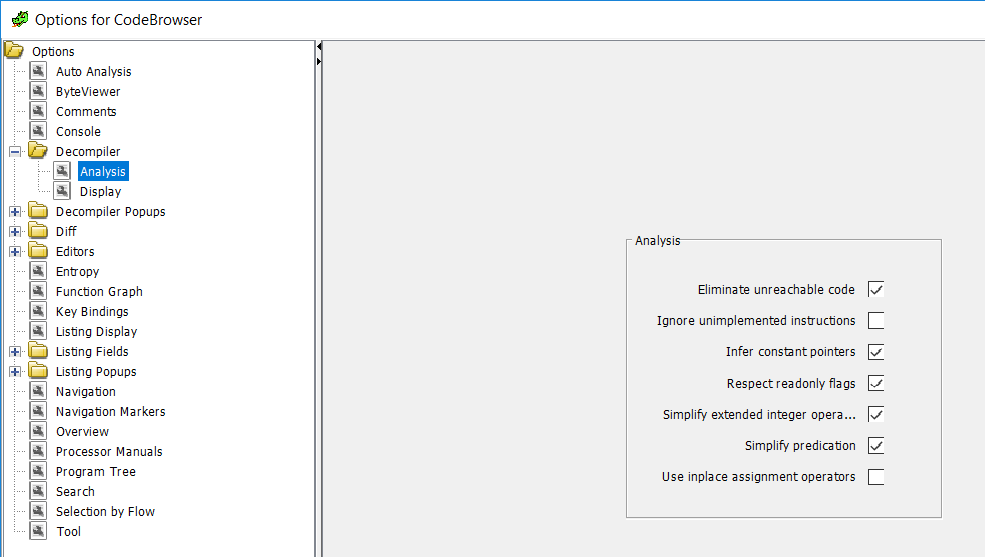
So, while I was poking around at the options, I happened across 'Eliminate unreachable code' as an option for decompiler analysis.

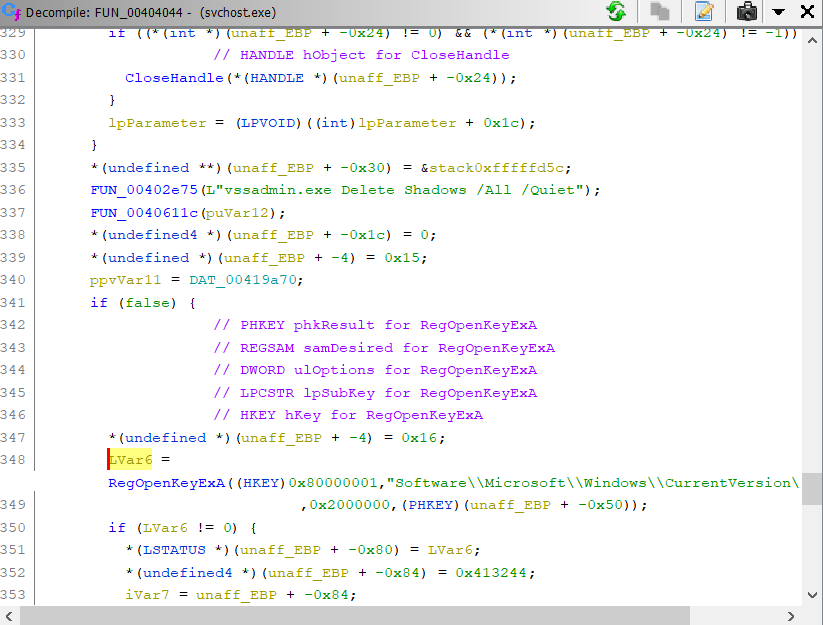
Unchecking that box and now I could see the API call I was looking for.

As I mentioned above, I don't know exactly how I'll use this going forward. If I leave it unchecked then the code simply doesn't show up in the decompiler window, but it still shows up in the disassembler, so that is a disconnect. But it also makes it clear that this is code I don't need to waste too much time analyzing because the decompilation process concluded that the code was unreachable. In a normal program, the programmer would probably instruct the optimizer to remove dead (unreachable) code, but malware authors are going to make our jobs as analysts harder by including code like this to waste our time. I'm not sure if the complete absence of the code in the decompiler window will help me more or whether seeing a big block of code enclosed in if (false) { ... } will be the more useful display. I guess we'll see as I spend more time playing with Ghidra. For now, I'm leaving it unchecked.
Again, if you have any tips or thoughts, feel free to e-mail me (see below), or use our contact page, or comment below.
---------------
Jim Clausing, GIAC GSE #26
jclausing --at-- isc [dot] sans (dot) edu

Comments