
Beagle: Graph transforms for DFIR data & logs
From About Beagle:
“Beagle is an incident response and digital forensics tool which transforms data sources and logs into graphs. Supported data sources include FireEye HX Triages, Windows EVTX files, SysMon logs and Raw Windows memory images. The resulting Graphs can be sent to graph databases such as Neo4J or DGraph, or they can be kept locally as Python NetworkX objects.
Beagle can be used directly as a Python library, or through a provided Web interface.”
Our use here will be through the Web interface running from Docker.
Beagle is beautifully documented, among the best I’ve ever seen, I strongly suggest reading it in its entirety before proceeding here. Well done, on so many fronts, to Omer Yampel, @yampelo, the project lead. I’m going to limit reprinting that content here and focus almost exclusively on specific use cases.
I did reach out to Omer for his insights on Beagle and received a plentiful response.
Per Omer, “Even though a lot of the work that I did with Beagle involved transforming the data into graphs, I think what you can do with it is the really cool part. I tried to capture that by showing how quickly you can pivot/investigate through incidents while retaining your context from the previous action (something that’s extremely hard to do in Splunk/ELK). I also tried to show what you might be able to do through the context menu on the web UI, showing how you can abuse the structure to quickly answer some common questions. For example, answering What happened after? by doing a depth first search from a node. I have more concrete examples in the slides from my Black Hat Asia Arsenal presentation.”
Omer’s Beagle Roadmap:
- “Allow users to stream/send arbitrary data to Beagle. The goal is to specify a schema which people follow (for example, the process ID field must be called “process_id” rather than “pid” or “processid”). Once the data is received, Beagle identifies entities, builds relationships, and returns the graph.
- Add more datasources!
- Integrate @cyb3rops’s sigma (https://github.com/Neo23x0/sigma). I really think graphs allow us to identify behaviors rather than signatures for specific actions. The fact that a node is a child of another node implies that the child node could not have occurred without the parent node, which is a really strong property in detection I think. Similarly, the subgraph of a node is everything that happened because of that node, which again, I think can make for way better signatures.
- Add support for functions to run on the graphs themselves. Similar to the context menu in the web interface, I want to support the same kind of thing in the Python library. That way people can develop analysis functions themselves, and potentially contribute them back.”
Thanks to Omer for all the detail!
Readying Docker
A quick primer on creating the Beagle Docker instance and running it with ease. I found it easiest to operate from a regular command prompt.
docker pull yampelo/beagle

mkdir data\beagle

docker run -v "/data/beagle":"/data/beagle" -p 8000:8000 yampelo/beagle
Browse to http://localhost:8000 and your Beagle instance will be waiting for, ready to ingest and graph. In terms of said ingestion, Beagle stands ready to consume:
- Windows Memory
- Procmon CSV
- Sysmon EVTX
- Windows EVTX
- VirusTotal v3 API Sandbox Reports
- FireEye HX Triage files
Uploading is as simple as select and click. Choose the file type, select the appropriately matched file, click Upload Data, wait a few seconds, then Submit as seen in Figure 1.
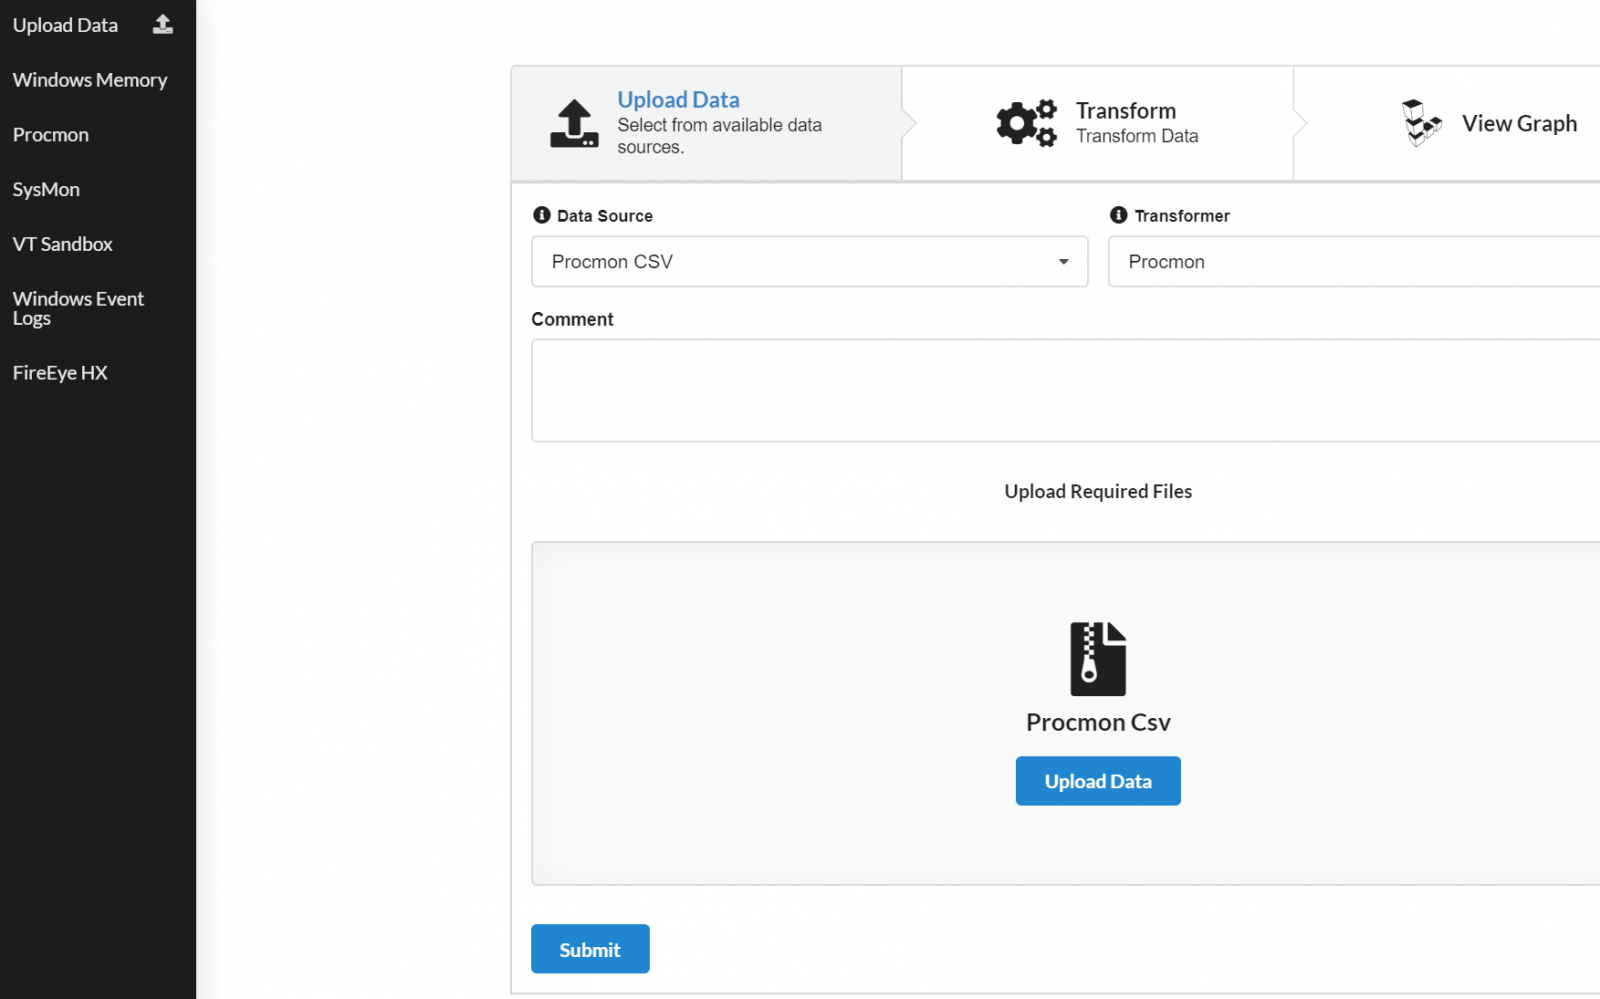
Figure 1: Beagle upload
For purposes of our toolsmith experiments I choose some select samples from my historical archive, including a number of memory images, Procmon files, and an exemplary Windows security event log. Don’t let the fact that I didn’t test VT, FireEye, or Sysmon samples limit you from doing so. Ease of use is substantial here, the only limiting factor is the potential for bloating your Docker image with logs or images ingested. If you’re going to turn Beagle into to a workhorse for your blue team and DFIR workloads, I strongly recommend you make use of Beagle’s Python API on a dedicated system with fairly beefy resources to enhance performance.
I selected these samples because they each tell interesting stories that have also been explored with other tools to further validate our assertions established here. I’ll start us off with two related file types from similar compromise scenarios. The attacks were classic phishing scenarios inclusive of an email with an attached invoice spreadsheet.
When experimenting with the malware sample, I did so as part of a toolsmith test for ProcDot, a somewhat related tool to Beagle in its visualization initiatives, but limited to Procmon and Pcap ingestion. As part of the initial analysis I generated a Procmon file and a memory image.
After you’ve uploaded your preferred log and memory samples, you’ll be greeted with a simple menu per category. You’ll find it helpful to add an identifying note during upload so you have sample context when you’re analyzing later. My Procmon selections are represented in Figure 2.
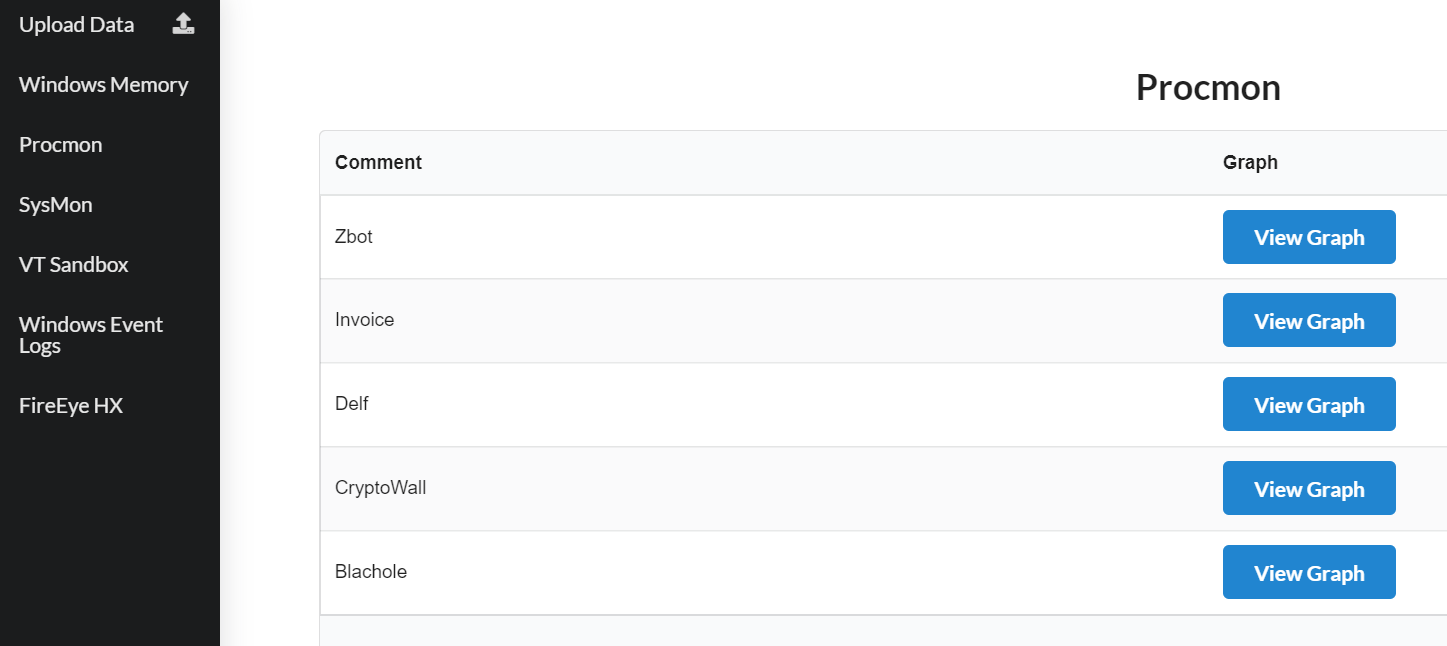
Figure 2: Procmon menu
I’ll begin with a graph for the Procmon CSV file generated from the above mentioned invoice malware analysis. Beagle includes an excellent Node Search feature; given that the opening graph is not particularly revealing I thought it best to try to zoom to a featured node. Rather than create static images that fail to do Beagle justice representing its usefullness, I’ve created video captures of the click-throughs, similar to those on Omer’s GitHub site. I first searched the keyword invoice and immediately landed on the sample execution process labeled Invoice_Trailcore_100355038.exe. I selected that process entity in the search results, then double-clicked the node in the graph. Figure 3 speaks for itself at this point.
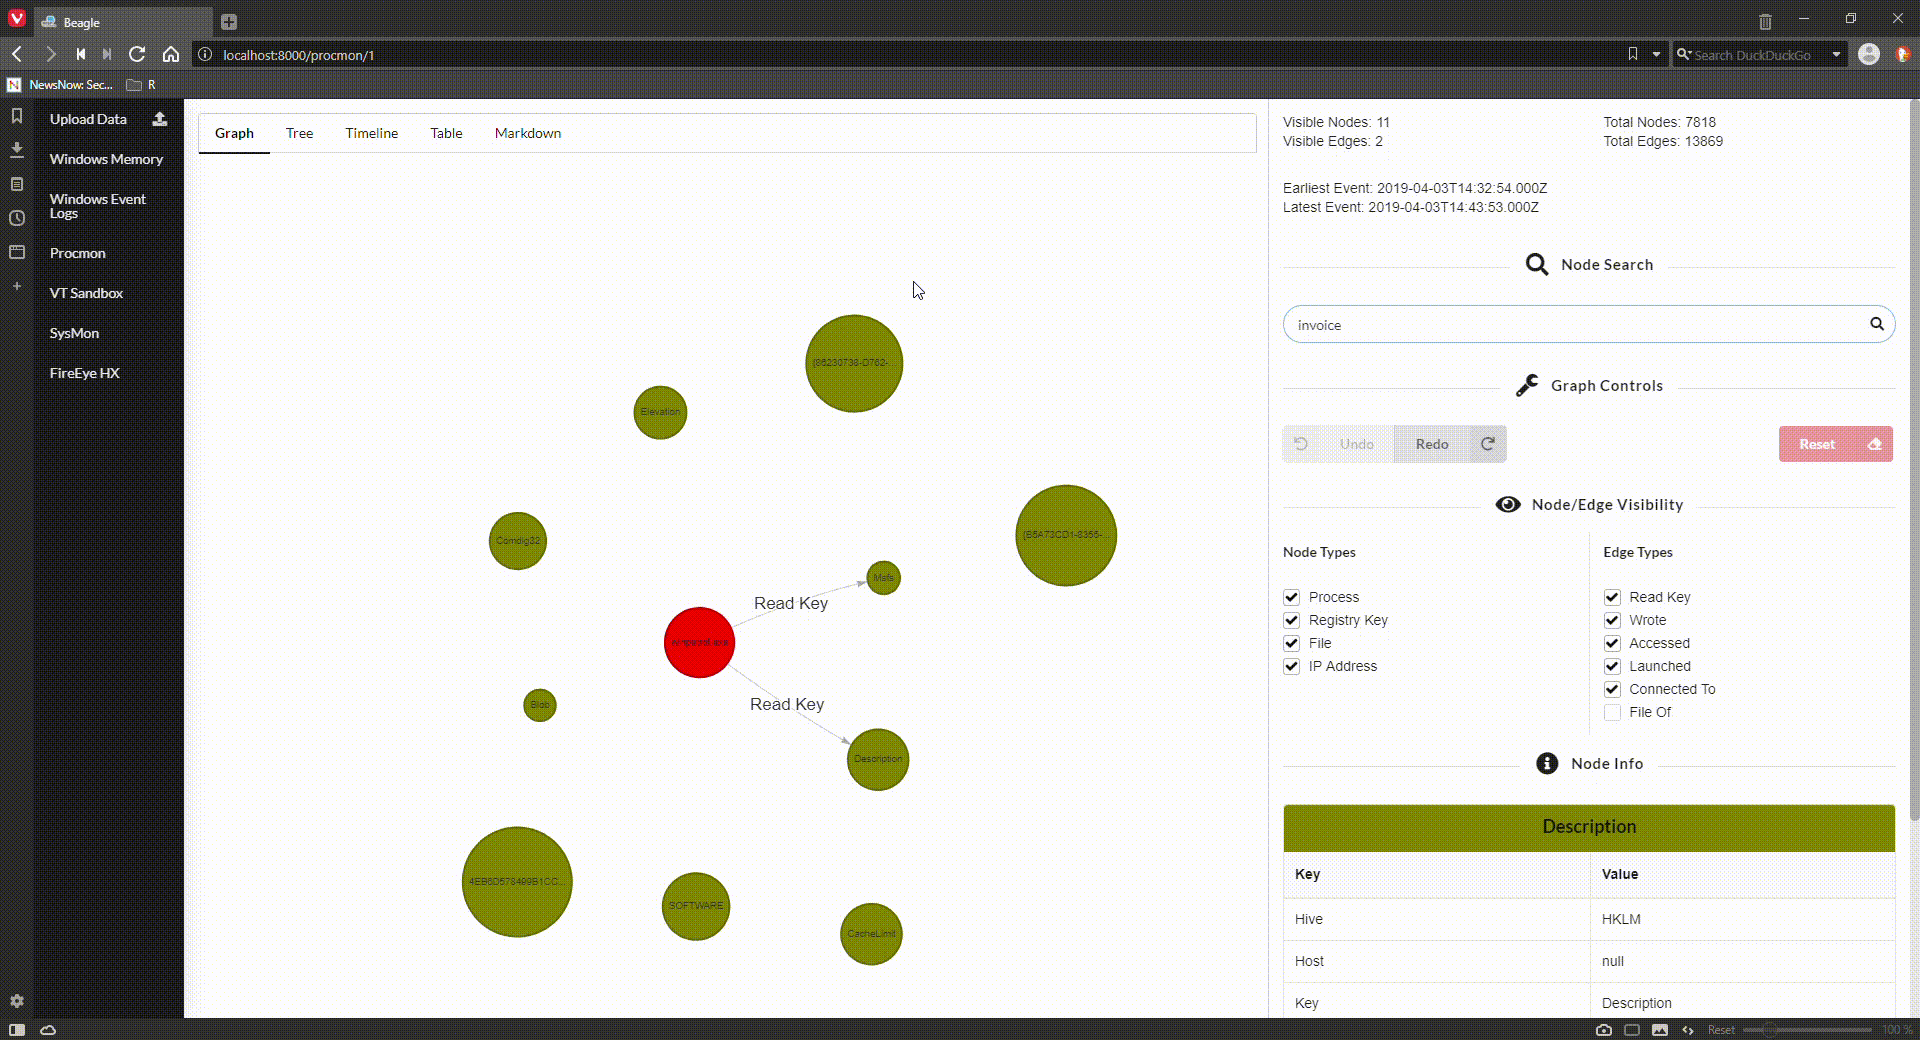
Figure 3: Malicious invoice process actions
Don’t forget to drill in to Tree, Timeline, and Table views in addition to the Graph. They’re equally revealing dependent on your goals. Forensicators will truly appreciate Timeline in particular.
I then moved to the related memory image to see what consistencies or correlation might be identified. Again, using the invoice keyword to pivot, I found that both samples, albeit different but related, access and/or write to msvbvm60.dll, the Visual Basic 6.0 Runtime library, behavior consistent with Office-related files and macro malware. I then searched nodes across the Procmon log and the memory image for msvbvm60.dll to exemplify related behavior. The Procmon graph is far deeper, the memory image is limited in related artifacts but nonetheless correlates behaviorally. Note these are not the same malware samples, but related sample types acquired in the wild between June and August of 2013. Figure 4, is video of running through both graphs to render what I’m describing.
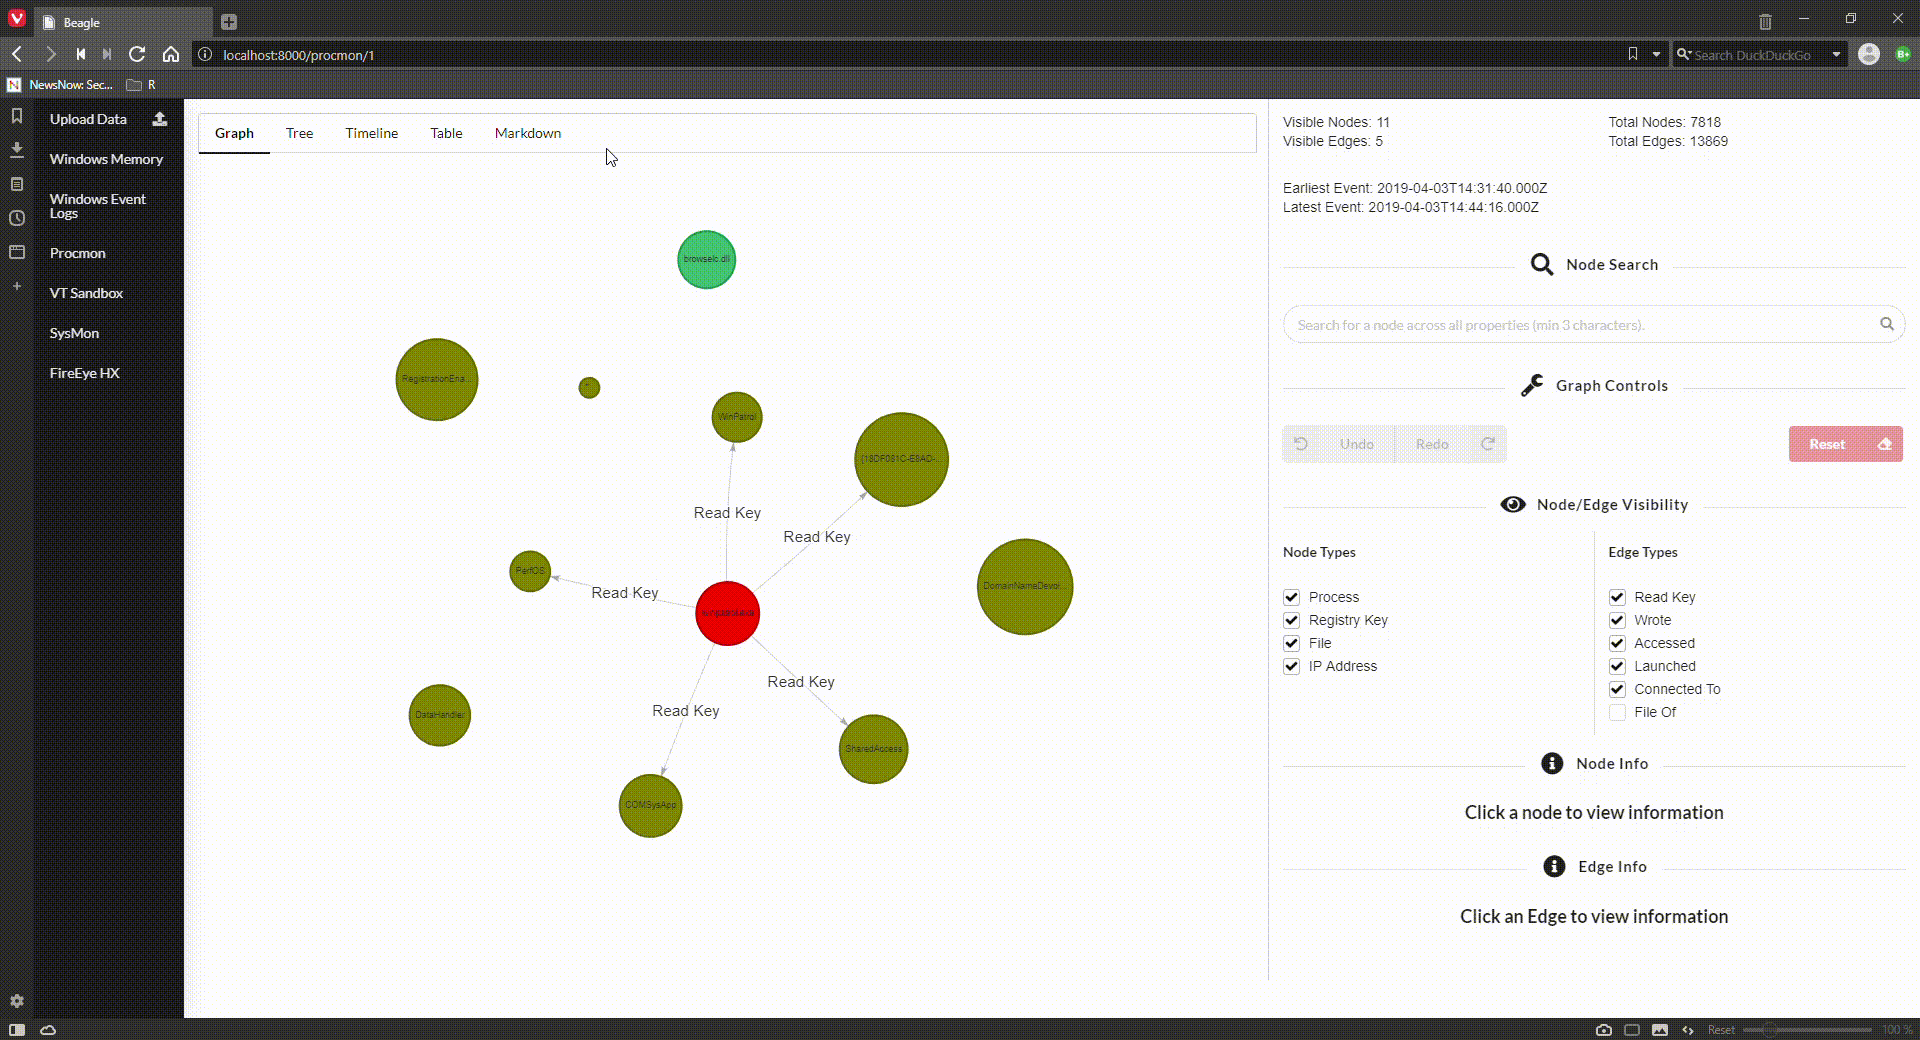
Figure 4: Invoice malware similarities across Procmon and memory samples
I noted that in the Procman graph we also see clear evidence of the sample execution causing a crash dump. You can see the node representing drwtsn32.exe, for the Dr. Watson crash dump service. There are also related calls to dwwin.exe, the Watson client.
One of favorite memory images is one from years ago taken from a system compromised with Trojan.APT.9002, the last version before the adversary went completely diskless, one of the very first to run in memory only. As we observe the graph in its opening state, we don’t note much of merit. I used Beagle’s node search to hunt for a known suspect process in this memory image, specifically 3176. It was an extremely easy pivot from there. In this case, 3176 turned out to be associated with rundll32.exe, which, in addition to reading nework connection-related registry keys, immediately tapped Internet history via index.dat. Experience the drill-down in Figure 5.
Figure 5: PID 3176 up to no good
My final example is another of my favorites, exhibiting malicious behavior captured in a Windows security event log from a log grabbed via a Red Team server as they were popping off with some of their typical mayhem. The Red Team we partner with, and I do mean partner (Go, Purple Team, go!), are artistic and advanced the majority of the time. I condsider them 2-3 years ahead of the industry and peer teams in mindset and tactics. Given the Purple Team approach we embraced years ago, their methods and approach serve both their customer and the Blue Team. We are definitely better for their efforts. But once in awhile they’ll go loud, and it visulizes gloriously. This graph represents one of the Red Team’s special multifunction payloads, I’ll give you no more detail than that, but enjoy the ride in Figure 6.
Figure 6: Red Team goes loud
Seems to me that said payload gets busy quickly, you likely noted that it launched numerous processes instantly, including cmd.exe, schtasks.exe, and taskeng.exe. Clearly, they’re establishing a swift foothold and seeking to persist. I love how Beagle represents processes in red, and the Red Team’s payload spawns yet more processes. Visual Red Team love for sure. Want a quick, dynamic graph, or would you prefer to hunt out those same spawned processes in a security event log without visual aid?
This is another case where I have not given an excellent tool its full due, but it’s so robustly documented, and well received by the community via significant infosec social media presences, as well as the likes Black Hat Asia Arsenal (shout out to @ToolsWatch. Again, please read the GitHub documentation in its entirety and consider leveraging the Python library after experimenting with the Docker image.
I haven’t been this excited by a new-to-me security tool in quite a while. I’ll go so far as to say that this is a real powerhouse, on par with my level of excitement for the likes of Volatility and Sysmon.
Congratulations to Omer for a job well done.
Cheers…until next time.


Comments