
No Wireshark? No TCPDump? No Problem!
Have you ever been on a pentest, or troubleshooting a customer issue, and the "next step" was to capture packets on a Windows host? Then you find that installing winpcap or wireshark was simply out of scope or otherwise not allowed on that SQL, Exchange, Oracle or other host? It used to be that this is when we'd recommend installing Microsoft's Netmon packet capture utility, but even then lots of IT managers would hesitate about using the "install" word in association with a critical server. Well, as they say in networking (and security as well), there's always another way, and this is that way.
"netsh trace" is your friend. And yes, it does exactly what it sounds like it does.
Type "netsh trace help" on any Windows 7 Windows Server 2008 or newer box, and you'll see the following:
C:\>netsh trace help
The following commands are available:
Commands in this context:
? - Displays a list of commands.
convert - Converts a trace file to an HTML report.
correlate - Normalizes or filters a trace file to a new output file.
diagnose - Start a diagnose session.
dump - Displays a configuration script.
help - Displays a list of commands.
show - List interfaces, providers and tracing state.
start - Starts tracing.
stop - Stops tracing.
Of course, in most cases, tracing everything on any production box is not advisable - especially if it's your main Exchange, SQL or Oracle server. We'll need to filter the capture, usually to a specific host IP, protocol or similar. You can see more on this here:
netsh trace show capturefilterhelp
One of the examples in this output shows you how t o e.g. 'netsh trace start capture=yes Ethernet.Type=IPv4 IPv4.Address=157.59.136.1'
You could also add Protocol=TCP or UDP and so on..
Full syntax and notes for netsh trace can be found here: https://technet.microsoft.com/en-us/library/dd878517
For instance, the following session shows me capturing an issue with a firewall that I'm working on. Note that you need admin rights to run this, the same as any capture tool. In a pentest you would likely specify an output file that isn't in the users' directory.
C:\>netsh trace start capture=yes IPv4.Address=192.168.122.2
Trace configuration:
-------------------------------------------------------------------
Status: Running
Trace File: C:\Users\Administrator\AppData\Local\Temp\NetTraces\NetTrace
.etl
Append: Off
Circular: On
Max Size: 250 MB
Report: Off
When you are done capturing data, it's time to stop it:
C:\> netsh trace stop
Correlating traces ... done
Generating data collection ... done
The trace file and additional troubleshooting information have been compiled as
"C:\Users\Administrator\AppData\Local\Temp\NetTraces\NetTrace.cab".
File location = C:\Users\Administrator\AppData\Local\Temp\NetTraces\NetTrace.etl
Tracing session was successfully stopped.
c:\
The cool thing about this is that it doesn't need a terminal session (with a GUI, cursor keys and so on). If all you have is a metasploit shell, netsh trace works great!
If this is a capture for standard sysadmin work, you can simply copy the capture over to your workstation and proceed on with analysis. If this is a pentest, a standard copy might still work (remember, we're on a Microsoft server), but if you need netcat type function to exfiltrate your capture, take a look at PowerCat (which is a netcat port in PowerShell).
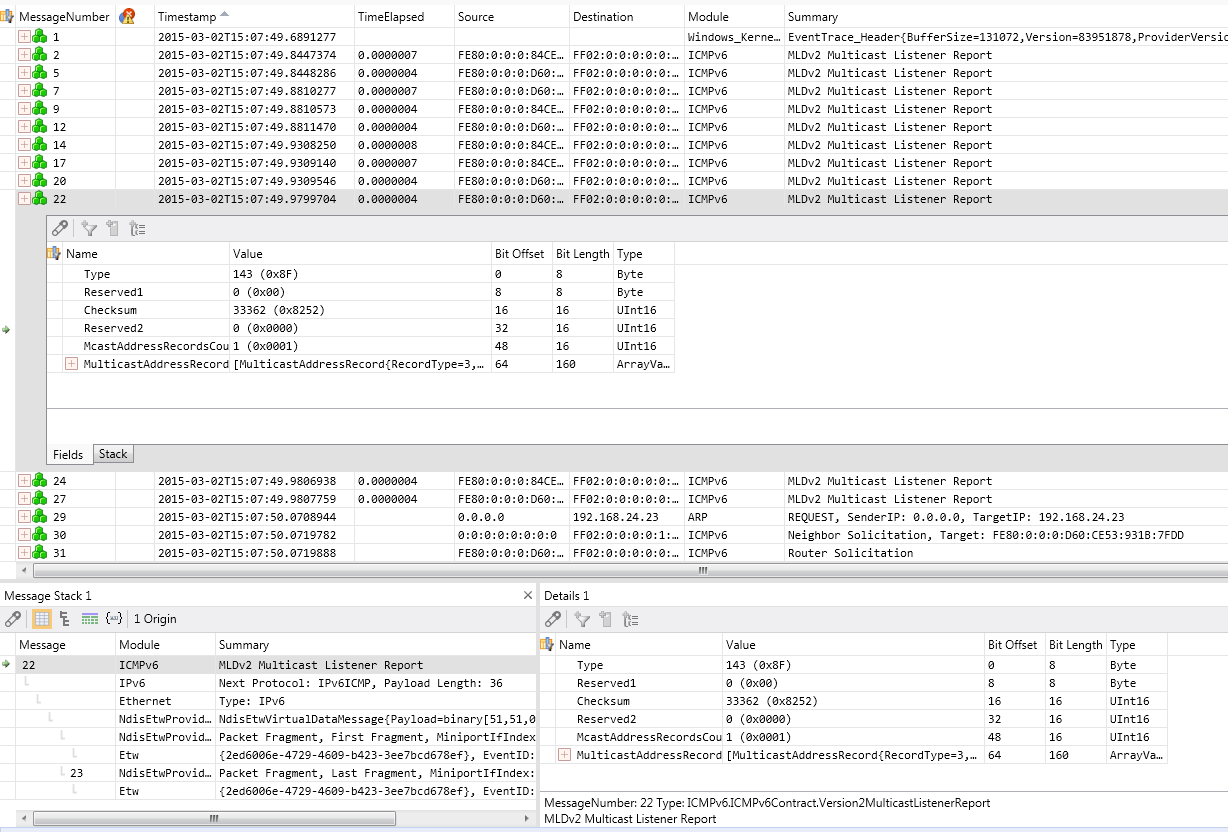
Next, open the file (which is in Microsoft's ETL format) in Microsoft's Message Analyzer app - which you can install on your workstation rather than the server we ran the capture on ( http://www.microsoft.com/en-us/download/details.aspx?id=44226 ). Message Analyzer has a surprisingly nice interface and some decent packet parsing, you might be able to wrap up your analysis just in this tool (see below).
If you do need another packet analysis tool, it's easy to a File / Save As / Export, and save as a PCAP file that Wireshark, tcpdump, SNORT, ngrep, standard python or perl calls, or any other standard tool can read natively.
Or you can convert to PCAP using PowerShell (of course you can). A short, simple script to do this might look like:
$s = New-PefTraceSession -Path “C:\output\path\spec\OutFile.Cap” -SaveOnStop
$s | Add-PefMessageProvider -Provider “C:\input\path\spec\Input.etl”
$s | Start-PefTraceSession
This Powershell cmdlet is not available in Windows 7 - you'll need Windows 8, or Server 2008 or newer
(This script was found at http://blogs.technet.com/b/yongrhee/archive/2013/08/16/so-you-want-to-use-wireshark-to-read-the-netsh-trace-output-etl.aspx )
If 'netsh trace' has solved an interesting problem for you, or was the tool that got you some interesting data in a pentest, please, use our comment form to let us know how you used it (within your NDA of course!)
===============
Rob VandenBrink
Metafore


Comments
Anonymous
Mar 4th 2015
1 decade ago
Anonymous
Mar 4th 2015
1 decade ago
powershell -command "import-module PEF; $s = New-PefTraceSession -Path '%~n1.cap' -SaveOnStop; $s | Add-PefMessageProvider -Provider '%~1' ; $s | Start-PefTraceSession"
Anonymous
Mar 4th 2015
1 decade ago
Anonymous
Mar 4th 2015
1 decade ago
Anonymous
Mar 4th 2015
1 decade ago
Dror
c:\>netsh trace
The following command was not found: trace.
c:\>run -l netsh
1) CHOSEN: netsh.exe [C:\Windows\SysWOW64]
2) netsh.exe [C:\Windows\winsxs\amd64_microsoft-windows-netsh_31bf3856ad364e35_6.1.7600.16385_none_bb95e7e51189d8f9]
3) windows - What appid should I use with netsh.exe- - Stack Overflow.url [F:\AWS\Sec]
c:\>run -1 netsh trace
Running: C:\Windows\SysWOW64\netsh.exe:
The following command was not found: trace.
c:\>run -2 netsh trace
Running: C:\Windows\winsxs\amd64_microsoft-windows-netsh_31bf3856ad364e35_6.1.7600.16385_none_bb95e7e51189d8f9\netsh.exe:
? -
convert - Converts a trace file to an HTML report.
correlate - Normalizes or filters a trace file to a new output file.
diagnose - Start a diagnose session.
dump -
help -
show - List interfaces, providers and tracing state.
start - Starts tracing.
stop - Stops tracing.
Anonymous
Mar 5th 2015
1 decade ago
Anonymous
Mar 5th 2015
1 decade ago
Anonymous
Mar 6th 2015
1 decade ago
- With "net trace" is possible to use persistent mode, to continue capturing even restarts.
- You can also filter the captured traffic : netsh trace show CaptureFilterHelp
Extracted from: http://www.sysadmit.com/2016/06/windows-capturar-trafico.html
Anonymous
Jun 6th 2016
9 years ago